
Understanding the US30: Your Gateway to Blue-Chip Performance
Welcome, aspiring and seasoned traders, to an insightful journey into the heart of the American stock market: the Dow Jones Industrial Average, commonly known as the US30. For decades, this index has served as a critical barometer for the health of the U.S. economy and a powerful indicator of investor sentiment. But what exactly is the US30, and why does it command such attention from global markets?
The US30 isn’t just a number; it represents the collective performance of 30 of the largest, most established, and financially sound companies in the United States. Think of it as a carefully curated portfolio of America’s industrial titans – companies that have proven their resilience and innovation over time. These are the blue-chip stocks, the household names that often dictate the broader market’s direction. Understanding the US30 is akin to gaining a fundamental understanding of the core engine driving the world’s largest economy. It provides us with a clear snapshot of how these leading corporations are performing, which, in turn, often reflects the overall economic landscape.
As investors and traders, our goal is to decipher the market’s language, to anticipate its next moves, and to position ourselves to capitalize on opportunities. The US30 offers a fertile ground for this endeavor, presenting both stability due to its mature constituents and dynamic movements influenced by a myriad of global and domestic factors. Whether you’re a beginner looking to understand market fundamentals or an experienced trader seeking to refine your technical analysis skills, a deep dive into the US30 is an indispensable part of your financial education. Are you ready to unravel the complexities and harness the potential of this iconic index?

Here are some key points about the US30:
- It consists of 30 blue-chip stocks representing various sectors.
- The index reflects market trends and investor confidence.
- Understanding its movements can inform trading strategies.
A Deep Dive into US30’s Recent Momentum: What the Numbers Tell Us
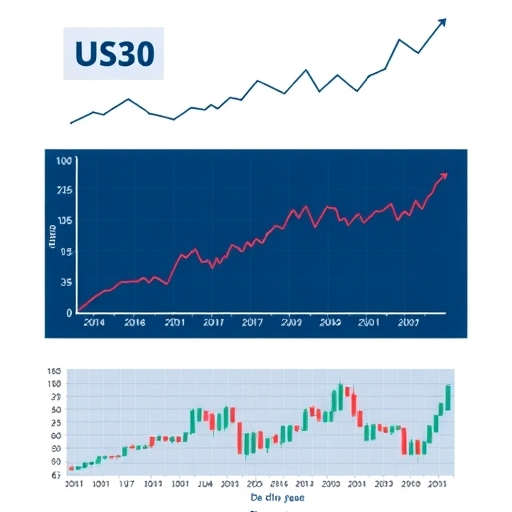
Let’s begin by grounding our discussion in the present, examining the recent performance of the US30. Understanding where we stand today is crucial before we delve into the ‘why’ and the ‘what next.’ The Dow Jones Industrial Average has recently demonstrated remarkable resilience and growth, painting a picture of cautious optimism within the financial markets. As of our last observation, the US30 was recorded trading at 44661, a figure that represents a significant gain from its previous sessions.
Specifically, the index marked an increase of 179 points, translating to a positive shift of 0.40% from the prior trading session. While daily fluctuations are a common feature of the stock market, observing trends over a longer period offers a more meaningful perspective. Over the last four weeks, the US30 has seen a robust gain of 3.65%. This short-term surge indicates a strong buying interest and a positive sentiment permeating the market during this period. What’s even more compelling is the index’s performance over the past year. The US30 has ascended by an impressive 12.06% over the last 12 months, signaling a powerful long-term upward trajectory. This annual growth reflects sustained investor confidence and a generally favorable economic environment for the blue-chip companies it represents.
These numbers are not merely statistics; they are the footprints of capital flows, the echoes of investor decisions, and the direct consequences of fundamental economic forces at play. A strong showing like this often suggests that institutional money is flowing into large-cap equities, driven by specific catalysts. But what truly underpins these impressive figures? What macroeconomic currents are propelling the Dow Jones higher, and are these tailwinds sustainable? As we proceed, we will dissect the primary drivers behind this momentum, helping you understand the forces that sculpt market movements.
To summarize the US30’s recent performance:
| Time Frame | Performance | Change (%) |
|---|---|---|
| Last Day | +179 Points | +0.40% |
| Last 4 Weeks | +3.65% | |
| Last Year | +12.06% |
The Fed’s Shadow: How Interest Rate Expectations Fuel the Dow
One of the most potent forces in any modern economy, and certainly in the U.S. financial landscape, is the Federal Reserve. Often referred to simply as the Fed, this central bank acts as the conductor of the economic orchestra, primarily through its influence on interest rates. For the US30, the Fed’s stance on monetary policy, particularly the anticipation of interest rate adjustments, plays an outsized role in shaping its trajectory. In recent times, a significant catalyst for the Dow’s impressive gains has been the widespread expectation of Federal Reserve rate cuts.
Why do rate cuts act as such a powerful stimulant for the stock market? When the Fed lowers interest rates, it generally makes borrowing cheaper for businesses and consumers alike. For companies, lower borrowing costs can translate into reduced operational expenses, higher profits, and increased investment in expansion. This improved profitability and growth potential tend to make stocks more attractive to investors. For consumers, lower rates mean cheaper mortgages and consumer loans, which can boost spending and, in turn, stimulate economic activity, further benefiting corporate earnings. This creates a “risk-on” environment, where investors are more willing to move capital from safer, lower-yielding assets (like bonds) into potentially higher-returning assets like equities.
The market’s reaction to potential rate cuts is often a forward-looking phenomenon. Investors don’t wait for the actual cuts; they price in the likelihood of such moves long before they occur. This speculation can lead to significant market rallies, as witnessed in the recent performance of the US30. However, this also introduces a degree of fragility. Any hint of a hawkish shift from the Fed, or a suggestion that rate cuts might be delayed or less aggressive than anticipated, can quickly reverse sentiment, leading to profit-taking and potential market pullbacks. Therefore, keeping a close eye on Fed announcements, economic data, and the nuanced language of policymakers is absolutely crucial for anyone trading or investing in the US30. Are you actively tracking the Fed’s signals in your market analysis?
Beyond Borders: China’s Influence on Dow’s Trajectory
While domestic policy and economic conditions are paramount, the intricate web of global relations, particularly with economic powerhouses like China, also exerts a profound influence on the US30. The health of the U.S. economy, and by extension the performance of its leading industrial companies, is inextricably linked to the global trade environment. In recent months, an undercurrent of optimism regarding China has served as another significant tailwind for the Dow Jones Industrial Average.
This optimism often stems from various factors, including the prospect of improved US-China trade talks and the potential for easing tensions. For multinational corporations within the US30, many of whom have substantial operations or supply chains in China, any positive developments in trade relations can significantly impact their profitability and market outlook. The mere expectation of tariff relief, for instance, can boost investor confidence, as it suggests reduced costs for imports and exports, leading to healthier margins for companies engaged in international trade. Consider how major corporations like Apple or Caterpillar, both of which have strong ties to the Chinese market, might see their prospects brighten with improved trade dialogue. Their performance, in turn, contributes to the overall strength of the US30.
Conversely, any deterioration in trade relations, such as escalating trade disputes or the imposition of new tariffs, can quickly become a significant headwind. Such developments introduce uncertainty, disrupt supply chains, and can dampen corporate earnings, leading to market fragility. This delicate dance between the two largest economies in the world means that news headlines related to US-China relations are not just geopolitical curiosities; they are direct market drivers that traders of the US30 must monitor diligently. How do you assess the geopolitical risks when making your trading decisions?
Key factors influencing the US30 include:
| Factor | Impact |
|---|---|
| Federal Reserve Policies | Influences borrowing costs and investment sentiment. |
| Geopolitical Events | Can create volatility and opportunity. |
| Corporate Earnings Reports | Provide insight into individual company performance. |
Unpacking Political Rhetoric: Trump, Powell, and Market Volatility
Beyond the realm of formal economic policy and trade agreements, the financial markets are remarkably sensitive to political rhetoric and the pronouncements of influential figures. For the US30, statements from political leaders, especially those impacting monetary policy or trade, can introduce swift and sometimes unpredictable volatility. We’ve seen this dynamic clearly illustrated by discussions involving figures like former President Donald Trump concerning Federal Reserve Chairman Powell.
Political commentary, even if informal, can quickly shape market sentiment. When a figure of high public profile like a former President expresses views on the independence or leadership of the Federal Reserve, or on specific trade policies, it sends ripples through the market. For instance, any speculation about the stability of the Fed’s leadership, or direct criticism of its policies, can introduce an element of uncertainty. Investors thrive on predictability, and anything that shakes that foundation, whether it’s concerns over potential firing of central bank chairs or a sudden shift in trade rhetoric, can lead to immediate market reactions. This often manifests as increased market volatility, where prices swing more dramatically in response to news.
The perceived impact of such statements isn’t always tied to their actual policy outcome; sometimes, the mere existence of the statement is enough to trigger a reaction based on speculation and fear. This highlights a crucial aspect of market psychology: markets are not purely rational machines. They are profoundly influenced by human emotions, perceptions, and the collective interpretation of information, however unofficial it may be. For traders, this means that monitoring political headlines and understanding their potential psychological impact on investor behavior is as important as analyzing economic data. It’s a reminder that the Dow Jones doesn’t operate in a vacuum; it’s intricately connected to the broader political and social currents that shape our world. Do you factor in the “headline risk” into your trading strategy?
Corporate Giants and Sectoral Strength: Tesla’s Ripple Effect
While macroeconomic factors and geopolitical shifts are undeniably powerful forces, the performance of individual corporate giants within the US30 also significantly contributes to the index’s overall health and movements. The Dow is, after all, an average of 30 specific companies. Therefore, positive corporate news or strong sector performance, particularly from innovative leaders, can generate a significant ripple effect across the entire index. A prime example of this can be seen in the impact of companies like Tesla.
Tesla optimism, often fueled by breakthroughs in technology, strong earnings reports, or regulatory developments, has demonstrably contributed to the Dow’s upward trajectory. When a high-profile company like Tesla, with its market-moving influence, announces positive developments – such as progress in self-driving technology or the easing of related regulations – it can ignite investor enthusiasm not just for that specific stock, but for the broader technology and industrial sectors represented in the US30. This optimism is infectious, suggesting that innovation and growth are thriving, which encourages broader market participation. For instance, if regulations on self-driving technology become more lenient, it opens up vast new market opportunities, not only for Tesla but also for other automotive and tech companies, potentially attracting more investment into the overall market.
This phenomenon illustrates the interconnectedness of the market. Strong performance or optimistic outlooks from even a few major constituents can lift the entire index. It underscores the importance of not just observing macro trends but also understanding the micro-level developments within the key sectors that constitute the US30. Companies like Tesla, with their disruptive potential and significant market capitalization, can act as bellwethers for innovation and growth within the economy, impacting how investors perceive the future prospects of the industrial average. How closely do you follow the news of major companies within the US30?
Forecasting the Future: Navigating US30’s Outlook with Expert Projections
As savvy traders and investors, our gaze is often fixed on the future. While past performance offers valuable insights, understanding potential future movements of the US30 is crucial for strategic planning. Fortunately, we can lean on the expertise of financial analysts and sophisticated global macro models to provide forward-looking perspectives. One such reputable source is Trading Economics, which offers quantitative forecasts for major indices like the Dow Jones Industrial Average.
According to their projections, the US30 is anticipated to reach a price of 43154 by the end of the current quarter. What does this forecast suggest? It indicates a potential short-term consolidation or even a slight pullback from its most recent highs. This could be interpreted as the market taking a breather after a period of rapid gains, or perhaps reflecting an anticipation of mild headwinds that might temper growth in the immediate future. For a technical trader, this might suggest looking for areas of support where the price could stabilize before resuming an upward trend, or identifying potential resistance levels if a pullback materializes.
Looking further out, the one-year forecast for the US30 stands at 39776. This longer-term projection, if it materializes, would represent a more significant revaluation or a substantial downtrend from current levels. Such a forecast indicates that analysts might be factoring in potential future challenges, such as a shift in monetary policy, a cooling economy, or unforeseen geopolitical events that could impact corporate earnings and market sentiment over a more extended period. It’s a sobering thought that highlights the inherent uncertainties in market forecasting. It underscores the importance of not solely relying on one forecast but using them as part of a broader analytical framework that includes your own research and risk assessment. How do you integrate expert forecasts into your personal trading strategy?
The Broader Market Canvas: US30 in Relation to Other Assets
No financial instrument exists in isolation, and the US30 is certainly no exception. Its movements are often intertwined with, and influenced by, the performance of other major indices and various asset classes across the global financial market. Understanding the US30 within this broader context offers a more holistic view and can reveal important intermarket correlations that inform our trading decisions.
Consider the relationship between the US30 and other prominent U.S. equity indices, such as the NAS100 (Nasdaq 100) and the S&P 500. While all three generally move in the same direction, their internal compositions differ, leading to nuanced performance variations. The NAS100 is heavily weighted towards technology stocks, while the S&P 500 offers a broader representation of 500 large-cap companies across various sectors. The US30, with its focus on 30 industrial giants, provides a snapshot of established industries. Observing how these indices move in tandem or diverge can offer insights into which sectors are leading or lagging the market. For instance, if the US30 is outperforming the NAS100, it might suggest a rotational shift from growth stocks to value or industrial stocks.
Beyond equities, macroeconomic factors that influence the US30 also ripple through other asset classes. Expectations of Fed rate cuts, for example, not only impact stocks but also have significant implications for forex markets (e.g., strengthening or weakening the USD against pairs like EUR/USD), commodities (like Gold, WTI, and Brent, which can be affected by inflation expectations and global demand), and even the burgeoning cryptocurrency market (Bitcoin, Ethereum). A “risk-on” mood, which propels the Dow, might also encourage investment in higher-risk assets like certain cryptocurrencies. By analyzing these intermarket relationships, you can gain a deeper understanding of the underlying macro themes driving capital allocation and enhance your ability to predict the next big moves across various markets. How do you utilize intermarket analysis in your approach?
Mastering Technical Analysis: Decoding US30’s Price Action
For those looking to delve deeper into the mechanics of market movements, technical analysis offers an indispensable toolkit for dissecting the US30’s price action. While fundamental factors tell us *why* the market should move, technical analysis focuses on *how* it is moving, using historical price and volume data to predict future trends. It is the art and science of reading the market’s own story as told through its charts.
One of the foundational concepts in technical analysis is understanding trends. Is the US30 in an uptrend, downtrend, or a sideways consolidation? Identifying the prevailing trend is crucial, as the old adage goes, “the trend is your friend.” You can identify trends using various tools, such as moving averages, trend lines, or by simply observing higher highs and higher lows for an uptrend, or lower lows and lower highs for a downtrend. Beyond trends, understanding support and resistance levels is paramount. These are price points where the US30 has historically found difficulty breaking above (resistance) or below (support). They act as invisible barriers, often indicating potential reversal points or areas where significant buying or selling pressure might emerge. Volume, or the number of shares traded, can also provide critical confirmation of price movements; a strong move on high volume is often more significant than one on low volume.
Furthermore, technical analysts employ a wide array of indicators to gain additional insights. These include momentum indicators like the Relative Strength Index (RSI), which tells us if the US30 is overbought or oversold, or oscillating indicators like MACD (Moving Average Convergence Divergence) that identify trend strength and potential reversals. Chart patterns, such as head and shoulders, double tops/bottoms, or flags, also offer predictive insights into future price targets and potential trend changes. By combining these tools – identifying trends, marking key support and resistance, monitoring volume, and interpreting indicator signals – you can develop a comprehensive framework for decoding the US30’s complex dance, allowing you to make more informed trading decisions. Are you integrating these technical tools into your trading regimen?
Risk Management and Strategy: Your Shield in the Volatile Market
In the dynamic world of trading, particularly with an index like the US30 that can exhibit significant volatility, having a robust risk management strategy is not merely an option—it is an absolute necessity. While the allure of substantial gains is powerful, the potential for losses is equally real. Our mission as successful traders is not just to maximize profits, but more importantly, to preserve capital and ensure longevity in the market. Think of risk management as your impenetrable shield, protecting you from the inevitable arrows of market uncertainty.
One of the cornerstone principles of risk management is defining your risk per trade. This means determining how much of your total trading capital you are willing to risk on any single position, often expressed as a small percentage (e.g., 1-2%). This prevents a single losing trade from significantly depleting your account. Coupled with this is the diligent use of stop-loss orders. A stop-loss is a pre-determined price level at which you will automatically exit a losing trade, capping your downside. It’s a non-negotiable component of disciplined trading, preventing small losses from escalating into catastrophic ones. Imagine going into battle without knowing your exit strategy; a stop-loss provides that crucial escape route.
Position sizing is another critical element. This refers to calculating the appropriate number of units (or contracts, in the case of CFDs) to trade based on your risk per trade and the distance to your stop-loss. Proper position sizing ensures that even if your stop-loss is triggered, you only lose your predefined acceptable amount. Diversification, while typically associated with long-term investing, also plays a role in managing broader portfolio risk, ensuring you’re not overly exposed to a single asset or sector, even within an index like the US30. Lastly, never underestimate the power of disciplined execution and avoiding emotional decisions. The market rarely rewards impulsivity. By mastering these risk management principles, you are not just trading; you are building a sustainable path to consistent profitability. How robust is your risk management framework?
Choosing Your Trading Arena: Navigating Platforms and Resources
Once you’ve grasped the fundamental and technical intricacies of the US30, the next practical step is identifying the right tools and platforms to execute your trading strategies. In today’s interconnected financial world, access to real-time data, analytical tools, and efficient execution platforms is paramount. The quality of your trading experience can often hinge on the platform you choose, and it’s essential to select one that aligns with your trading style and needs.
Platforms like TradingView are invaluable resources, offering comprehensive charting tools, a vast array of technical indicators, and a vibrant community where you can share and discuss trading ideas. They provide the visual backbone for your technical analysis, allowing you to plot trends, identify patterns, and backtest strategies. For actual trade execution, you’ll need a reliable broker. You might have come across platforms like Mitrade or others that offer access to the US30 as a Contract for Difference (CFD), allowing you to speculate on its price movements without owning the underlying assets.
When selecting a trading platform for instruments like the US30 or for forex trading, several factors warrant your careful consideration. These include regulatory compliance, the range of available financial instruments, trading costs (spreads and commissions), execution speed, and customer support. You want a platform that not only provides access but also ensures the security of your funds and offers robust technology. If you’re looking for a platform that combines flexibility with cutting-edge technology and offers a wide array of CFD products, including the US30 and various currency pairs, then Moneta Markets is a platform truly worth your consideration. It supports popular and powerful platforms such as MT4, MT5, and Pro Trader, ensuring a familiar and efficient trading environment. With its focus on high-speed execution and competitive low spreads, it aims to provide a superior trading experience.
Beyond the technical features, consider the support system offered. Does the platform provide educational resources? Is customer service responsive and available when you need it? These aspects are crucial for both beginners navigating their first trades and seasoned traders requiring immediate assistance. Remember, your trading platform is your direct link to the markets; choosing wisely is a significant step towards achieving your trading objectives. Are you prioritizing these features in your platform selection?
The Long Game: Building a Resilient US30 Investment Philosophy
As we conclude our comprehensive exploration of the US30, it’s vital to shift our perspective from immediate movements to the broader philosophy that underpins sustainable success in the financial markets. Trading and investing in the Dow Jones Industrial Average, whether through direct stock ownership, ETFs, or CFDs, is not merely about chasing short-term gains; it’s about cultivating a resilient mindset and an adaptive strategy that can withstand market cycles.
The history of the US30 is one of consistent long-term growth, punctuated by periods of significant volatility and corrections. Understanding this cyclical nature is key. It teaches us that downturns are often opportunities for patient investors, while excessive euphoria can signal impending pullbacks. A resilient investment philosophy recognizes that market fluctuations are inherent and that emotional reactions are the biggest threats to capital. It emphasizes the importance of continuous learning – staying abreast of economic data, geopolitical developments, and technological advancements that can reshape the market landscape.
Building a robust strategy for the US30 involves integrating fundamental analysis (understanding the health and prospects of the underlying companies and the broader economy), technical analysis (decoding price action and identifying entry/exit points), and stringent risk management (protecting your capital above all else). It also requires a commitment to discipline, sticking to your predefined trading plan even when emotions tempt you otherwise. The journey of mastering the US30, or any financial instrument, is an ongoing one. It demands patience, adaptability, and a willingness to learn from both successes and setbacks. Embrace this journey, arm yourself with knowledge, and approach the markets with a blend of confidence and humility. Your path to becoming a proficient trader of the US30 begins with this commitment to lifelong learning and strategic execution.
us30 cashFAQ
Q:What is the US30?
A:The US30 is an index that represents the performance of 30 large, publicly traded companies in the United States.
Q:Why is the US30 important for investors?
A:The US30 serves as a barometer for the U.S. economy and reflects investor sentiment towards blue-chip stocks.
Q:How can I trade the US30?
A:You can trade the US30 through various platforms that offer access to indices, often via contracts for difference (CFDs).
留言