

Introduction to the Cboe VIX Index

Financial markets are rarely still. They shift constantly, oscillating between long stretches of stability and sudden bursts of turbulence. For those managing portfolios or making strategic investment decisions, recognizing the mood of the market is just as important as analyzing fundamentals. One of the most telling indicators of this underlying sentiment is the **Cboe VIX Index**. Frequently referred to as the “fear gauge,” the VIX offers a real-time snapshot of how much volatility traders expect in the S&P 500 over the next 30 days. Created by the Chicago Board Options Exchange (Cboe), it has become a cornerstone metric for assessing investor psychology. Rather than tracking price movements directly, it captures the market’s collective anticipation of change—making it a vital tool for anyone seeking to understand not just where the market is, but where it might be headed.
What is the VIX Index? A Core Definition and Purpose
At its core, the **VIX Index** is a forward-looking indicator that reflects the market’s expectation of near-term volatility. The term “Cboe” refers to the Chicago Board Options Exchange, the institution that developed and maintains this benchmark. Unlike traditional indices such as the S&P 500 or Dow Jones, which measure asset prices, the VIX quantifies implied volatility—essentially, the market’s best guess on how much the S&P 500 might swing in either direction over the coming month. This makes it a unique and powerful lens into investor sentiment. When uncertainty rises, the VIX climbs; when confidence prevails, it tends to fall. Its primary role is to provide traders, analysts, and institutions with a standardized, easily interpretable signal of expected market turbulence. Because it’s derived from real-time trading activity, it responds quickly to shifting conditions, offering insights that are both timely and actionable.
How the VIX is Calculated: The Methodology Explained
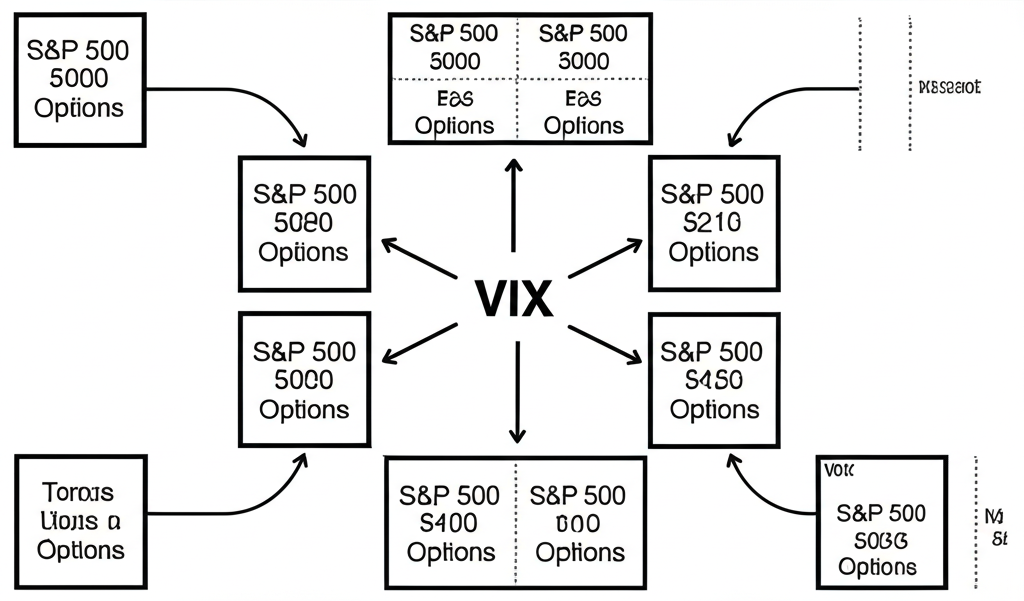
The VIX isn’t built on past price swings or historical averages. Instead, it uses a sophisticated, model-free formula that analyzes the prices of a broad range of S&P 500 index options—specifically, out-of-the-money calls and puts with expirations between 23 and 37 days out. These options act as insurance contracts: when investors fear a market drop, they buy puts; when they anticipate sharp moves in either direction, they bid up the prices of both calls and puts. The VIX captures this behavior by extracting the implied volatility from these contracts. By weighting and aggregating the implied volatilities across multiple strike prices and expiration dates, the Cboe constructs a single, consensus-driven estimate of expected 30-day volatility. This approach avoids reliance on theoretical pricing models, making the VIX a direct reflection of actual market pricing and expectations. For those interested in the technical details, the Cboe’s official VIX whitepaper provides a comprehensive breakdown of the calculation methodology.
Interpreting VIX Levels: What Do the Numbers Really Mean?
While the VIX is a dynamic number that changes by the minute, certain ranges have developed strong interpretive significance over time. Understanding these levels helps contextualize market conditions and investor behavior.
| VIX Level Range | Market Interpretation |
|---|---|
| Below 20 | Generally indicates a calm, stable, or complacent market environment. Investors perceive low risk. |
| 20-30 | Suggests moderate uncertainty and increasing investor concern. Volatility is rising but not yet extreme. |
| Above 30 | Signifies high market fear, significant uncertainty, and expected large price swings. Often correlates with sharp market downturns. |
| Above 40-50 | Represents extreme fear and panic, typically seen during major financial crises or systemic shocks. |
It’s important to recognize that the VIX and the S&P 500 typically move in opposite directions. When stocks plummet, the VIX often spikes as investors rush to buy protection. During strong bull markets, the VIX usually drifts lower, reflecting confidence and reduced demand for hedges. However, this inverse relationship isn’t absolute—there are periods when both rise together, particularly during times of high uncertainty even amid price gains. Context, therefore, is critical when interpreting VIX readings.
The VIX as a “Fear Gauge”: Understanding Market Psychology
The nickname “fear index” isn’t just a catchy label—it’s rooted in observable investor behavior. When market participants grow concerned about potential losses, they often turn to options as a form of portfolio insurance. The most common strategy involves buying out-of-the-money put options on the S&P 500, which gain value if the market drops. As demand for these protective contracts increases, their prices rise, and so does their implied volatility. Since the VIX is built from exactly these implied volatilities, a surge in demand for downside protection directly translates into a higher VIX. In essence, the index captures the price of insurance in the market. A rising VIX means investors are paying more to hedge their positions, signaling heightened anxiety. This psychological dimension makes the **VIX Index** more than a statistical measure—it’s a real-time pulse check on market confidence.
Historical VIX Trends and Major Market Correlates
Looking back at the VIX’s performance over the past few decades reveals a clear pattern: prolonged periods of low volatility punctuated by sharp, dramatic spikes during times of crisis. One of the most notable examples occurred during the 2008 financial meltdown, when the VIX climbed above 80 in October—a level that reflected near-panic conditions across global markets. Similarly, in March 2020, as the full scale of the COVID-19 pandemic became clear and economies shut down, the VIX again surged past 80, mirroring the sudden collapse in investor confidence. These spikes weren’t anomalies; they were direct responses to systemic shocks. On the other end of the spectrum, during the extended bull market from 2009 to early 2020, the VIX frequently traded in the teens, sometimes dipping below 10, signaling a prolonged period of investor complacency. This cyclical behavior—calm followed by crisis, then recovery—underscores the VIX’s value as a leading indicator of market stress.
Accessing Current Cboe VIX Data and Interactive Charts
For traders and analysts, staying updated on VIX movements is essential. The most authoritative source for real-time **indexcboe vix** data is the Cboe’s official website, which offers live values, historical data, and detailed methodology documents. Beyond the source, platforms like Bloomberg, Reuters, and Yahoo Finance provide accessible dashboards with interactive VIX charts, enabling users to compare its trajectory with the S&P 500, analyze long-term trends, and identify potential turning points. Many brokerage platforms also integrate VIX data directly into trading interfaces, allowing for real-time monitoring alongside portfolio performance. These tools make it easier than ever to incorporate volatility analysis into daily decision-making, whether for risk management or strategic positioning.
Trading and Investing with the VIX: Products and Strategic Applications
Although the VIX itself is not a tradable asset, the financial industry has developed instruments that allow investors to gain exposure to volatility. The most widely used are VIX futures and options. These derivatives enable traders to speculate on future volatility levels or hedge against market downturns. For example, an investor anticipating a market correction might buy VIX futures, which tend to rise in value when volatility spikes. Conversely, during stable periods, these contracts may lose value as the VIX declines. Institutional investors often use these tools as part of broader risk mitigation strategies, particularly during times of elevated uncertainty. However, trading volatility is inherently complex due to factors like contango and backwardation in the futures curve, and it carries substantial risk. These products are best suited for experienced market participants who understand the nuances of derivatives pricing and market structure.
An Overview of VIX Futures and Options
VIX futures are standardized contracts that obligate the buyer to purchase—or the seller to deliver—the value of the VIX Index at a specified future date. These contracts are cash-settled and based on the Special Opening Quotation (SOQ) of S&P 500 options on the settlement date. Traders use them to take directional bets on volatility or to hedge equity exposure. VIX options, on the other hand, give the holder the right—but not the obligation—to buy or sell a VIX futures contract at a predetermined price before expiration. This flexibility allows for a range of strategies, from simple long calls during expected turbulence to complex spreads designed to profit from volatility convergence. Because these instruments are tied to an index that measures expectations rather than prices, their behavior can be counterintuitive, especially during fast-moving markets. As such, they require careful analysis and risk management.
Common Misconceptions About the VIX Index
Despite its prominence, the **VIX Index** is frequently misinterpreted. One of the most persistent myths is that a high VIX predicts a market crash. In reality, it measures expected volatility, not direction. A spike in the VIX means the market anticipates large price swings—but those could be up or down. While sharp increases often coincide with sell-offs, they don’t guarantee further declines. Another misconception is that the VIX remains elevated throughout bear markets. In fact, it tends to peak during sudden sell-offs and may decline even if the market continues to fall gradually. Additionally, treating VIX levels as absolute benchmarks can be misleading. A reading of 25 might seem high in a low-volatility era but could be considered moderate during a period of sustained stress. The key is to view the VIX relative to its own historical range and in the context of broader market conditions.
Beyond the Basics: Advanced Insights and Predictive Factors for VIX
While the VIX is driven primarily by investor sentiment and options market activity, it’s also influenced by broader macroeconomic and geopolitical forces. Key economic reports—such as inflation data, employment figures, and GDP growth—can shift market expectations and trigger volatility. For instance, a surprise rise in inflation might prompt fears of aggressive rate hikes, leading to a VIX spike. Central bank policy plays a particularly strong role: dovish signals often calm markets and suppress volatility, while hawkish tones can introduce uncertainty and push the VIX higher. Geopolitical events—like wars, elections, or trade disputes—also have a measurable impact. The outbreak of conflict in Eastern Europe in 2022, for example, caused an immediate jump in the VIX as investors priced in energy shocks and supply chain disruptions. While these factors don’t allow for precise forecasting, monitoring them helps build a more complete picture of what might drive volatility in the near term.
Conclusion: Leveraging the VIX for Informed Financial Decisions
The Cboe VIX Index is more than a number—it’s a dynamic reflection of market psychology and a critical tool for navigating financial uncertainty. By measuring the implied volatility of S&P 500 options, it provides a real-time gauge of investor expectations over the next 30 days. Understanding how it’s calculated, how to interpret its levels, and how it responds to major events allows investors to make more informed choices. While it shouldn’t be treated as a crystal ball for market direction, the **indexcboe vix** offers invaluable insights into risk sentiment, hedging demand, and potential turning points. When used alongside fundamental analysis, technical indicators, and macroeconomic data, it becomes a powerful component of a well-rounded investment strategy. In a world where volatility is inevitable, the VIX helps bring clarity to the chaos.
Frequently Asked Questions (FAQ)
1. What exactly is the Cboe VIX Index and why is it often referred to as the “fear index”?
The Cboe VIX Index is a real-time market index that measures the market’s expectation of 30-day forward-looking volatility of the S&P 500 index. It’s called the “fear index” because it tends to rise sharply during periods of market uncertainty and investor apprehension, as investors purchase protective options, driving up their implied volatility.
2. How is the VIX index calculated, and what underlying market data does it use?
The VIX is calculated using a “model-free” approach that aggregates the weighted prices of a wide range of out-of-the-money S&P 500 index options (both calls and puts) with expiration dates typically 23 to 37 days in the future. It essentially measures the implied volatility derived from these options’ market prices.
3. What is considered a “normal” VIX score, and how should investors interpret different VIX levels (e.g., below 20, 20-30, above 30)?
A “normal” VIX score is generally considered below 20, indicating a calm market. Levels between 20-30 suggest moderate uncertainty, while anything above 30 signifies high market fear and expected large price swings. Levels above 40-50 are indicative of extreme panic.
4. How does the VIX index correlate with the performance of the S&P 500 index and overall stock market volatility?
The VIX typically has an inverse relationship with the S&P 500. When the S&P 500 experiences sharp declines, the VIX usually spikes, reflecting increased market volatility and fear. Conversely, during periods of market stability or growth, the VIX tends to be lower.
5. Can the VIX be effectively used as a predictive tool for future stock market movements or downturns?
No, the VIX is not a direct predictive tool for market direction. It measures *expected* volatility, not the direction of future price movements. While VIX spikes often coincide with market downturns, it doesn’t predict them, nor does a high VIX guarantee further declines.
6. Where can I find reliable real-time data and historical charts for the indexcboe VIX?
Reliable sources for real-time and historical VIX data include the Cboe’s official website, major financial news portals like Bloomberg and Yahoo Finance, and various trading platforms.
7. What are VIX futures and options, and how do traders and investors utilize them?
VIX futures and options are financial instruments that allow traders and investors to gain exposure to future volatility or to hedge against market risk. VIX futures are agreements to buy or sell the VIX at a future date, while VIX options give the right (but not the obligation) to buy or sell VIX futures contracts.
8. Is 20% volatility considered high, and what are the implications of such a reading for portfolio management?
A VIX reading of 20% is generally considered to be at the upper end of calm or the beginning of moderate uncertainty. While not extremely high, it implies that market participants expect the S&P 500 to move by approximately 20% over the next year (annualized). For portfolio management, it suggests a need for increased vigilance and potentially considering hedging strategies or rebalancing towards less volatile assets.
9. What are some common misconceptions about the VIX index that investors should be aware of?
- The VIX directly predicts market direction (it doesn’t, it measures expected volatility).
- The VIX is always high during bear markets (it often spikes but can be low during gradual declines).
- VIX values are absolute rather than relative (their interpretation depends on historical context).
- The VIX measures historical volatility (it measures forward-looking implied volatility).
10. How do global economic events and geopolitical tensions typically influence the VIX?
Global economic events (e.g., inflation, recessions) and geopolitical tensions (e.g., conflicts, trade wars) often introduce significant uncertainty and risk into the markets. This heightened uncertainty typically leads to increased demand for protective options, causing implied volatility to rise, and consequently, the VIX to spike.
留言