

Introduction: Why TradingView Indicators Are Essential for Traders

In today’s fast-paced trading environment, having the right tools can make all the difference between guessing and strategizing. TradingView has emerged as a go-to platform for traders across the globe, offering a powerful, intuitive interface for charting and technical analysis. At the heart of its functionality lies a suite of indicators—mathematical calculations derived from price, volume, and time data—that transform raw market movements into actionable insights. These tools don’t just display numbers; they reveal patterns, highlight momentum shifts, and signal potential turning points in real time.
For both new and experienced traders, indicators serve as navigational aids in an often unpredictable market. Whether identifying a trend early, spotting overbought conditions, or measuring volatility, these analytical instruments help reduce emotional decision-making and increase the likelihood of well-timed entries and exits. From equities and forex to cryptocurrencies, the universal applicability of TradingView indicators makes them indispensable. This guide will explore the most effective ones, how to use them strategically, and how to enhance your edge with custom-built solutions.
How We Identified the “Best” TradingView Indicators

The term “best” is subjective in trading. What works flawlessly for a day trader in the crypto space may not suit a swing trader in the stock market. That’s why our selection process wasn’t based solely on popularity or algorithmic precision. Instead, we evaluated indicators through multiple lenses: their adoption across different trading communities, performance in various market conditions—ranging from volatile crypto swings to steady forex trends—and adaptability across timeframes and asset classes.
We also considered user sentiment—how frequently an indicator is shared, discussed, or recommended by active traders on the platform. But beyond numbers and likes, we focused on practical utility. Does the indicator offer clarity without clutter? Can it be combined with others to strengthen signal accuracy? Most importantly, does it serve a clear analytical purpose—be it trend confirmation, momentum tracking, or risk assessment?
Ultimately, the best indicators are those that align with your trading psychology, risk tolerance, and strategy. This guide is designed not to hand you a rigid formula, but to equip you with the knowledge to build a personalized toolkit that evolves with your experience.
The Top 7 Essential TradingView Indicators You Must Know
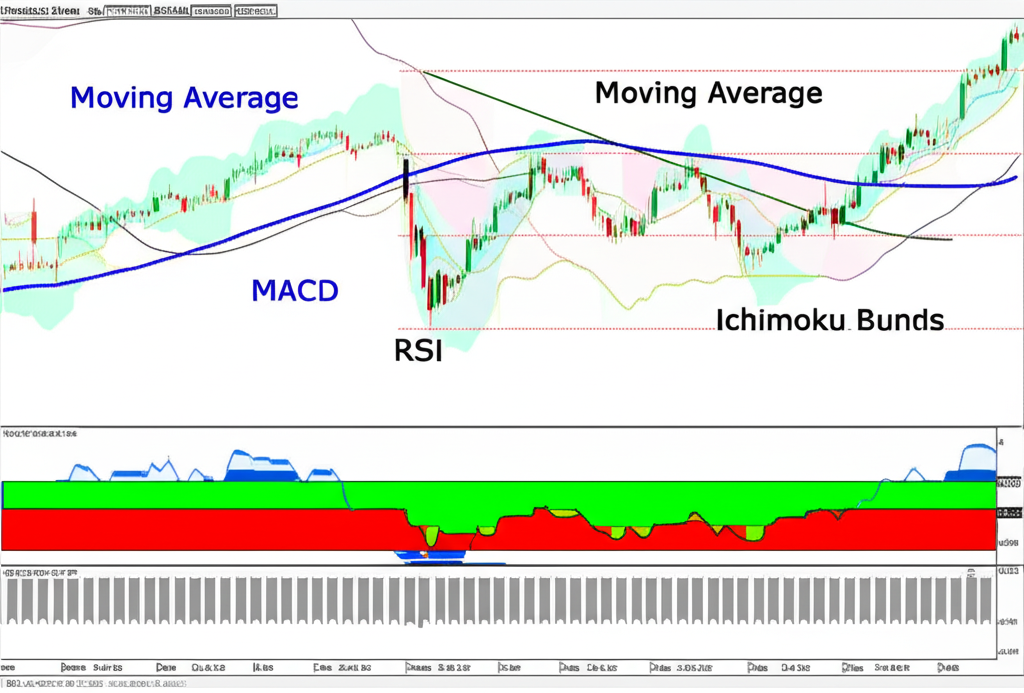
Mastering technical analysis begins with understanding the foundational tools that form the backbone of most successful trading strategies. These seven indicators have stood the test of time, consistently delivering valuable insights across markets and timeframes. While each serves a distinct purpose, their real power emerges when used in combination—creating a layered, high-conviction approach to market analysis.
1. Moving Averages (SMA & EMA)
Moving Averages smooth out price fluctuations to reveal the underlying trend. The Simple Moving Average (SMA) calculates the average closing price over a set period, offering a clear view of directional bias. The Exponential Moving Average (EMA), however, places greater weight on recent prices, making it more responsive to new market information.
Traders use these lines to determine trend direction—prices above the MA suggest bullish momentum, while those below indicate bearish pressure. One of the most popular techniques is the crossover strategy, where a short-term MA crossing above a long-term MA signals a potential uptrend (a “golden cross”), and the reverse may hint at a downturn (“death cross”). Additionally, moving averages often act as dynamic support and resistance levels, especially the 50, 100, and 200-period variants.
As Investopedia highlights, moving averages are fundamental for trend identification, making them a must-know for any trader building a technical foundation.
2. Relative Strength Index (RSI)
The Relative Strength Index (RSI) is a momentum oscillator that measures the speed and magnitude of price changes. Ranging from 0 to 100, it typically flags overbought conditions above 70 and oversold levels below 30. However, these thresholds aren’t automatic buy or sell signals—especially in strong trends, where RSI can remain elevated or depressed for extended periods.
More reliable are divergences: when price makes a new high but RSI fails to confirm it, this bearish divergence may signal weakening momentum. Conversely, a bullish divergence occurs when price hits a lower low but RSI forms a higher low, suggesting a potential reversal.
RSI is particularly useful in range-bound markets, where price oscillates between support and resistance. When combined with trend analysis, it becomes a powerful tool for timing entries and exits within broader market movements.
3. Moving Average Convergence Divergence (MACD)
The MACD is a hybrid indicator that combines trend-following and momentum elements. It consists of three components: the MACD line (the difference between a fast and slow EMA), the signal line (an EMA of the MACD line), and the histogram (the gap between the two lines).
A bullish signal is generated when the MACD line crosses above the signal line, while a bearish crossover occurs when it moves below. The histogram provides a visual pulse of momentum—expanding bars above zero indicate strengthening bullish momentum, while growing red bars below zero reflect increasing bearish force.
Traders also watch for divergences and centerline crossovers. When the entire MACD line moves above zero, it confirms bullish momentum, while a drop below zero suggests bearish dominance. Its versatility makes MACD a favorite for both short-term and medium-term traders.
4. Bollinger Bands (BB)
Bollinger Bands consist of a middle SMA flanked by two volatility-based bands that expand and contract based on market activity. The wider the bands, the higher the volatility; the narrower, the quieter the market.
One of the most valuable patterns is the “Bollinger Squeeze,” where tightening bands often precede explosive price moves. Traders watch for breakouts following a squeeze, using volume and momentum confirmation to filter false signals.
The bands also serve as dynamic overbought and oversold zones. In ranging markets, price bouncing off the lower band may signal buying interest, while touches of the upper band could indicate exhaustion. However, in strong trends, price can “ride” the bands, making it essential to distinguish between trending and consolidating environments.
5. Stochastic Oscillator
Like RSI, the Stochastic Oscillator measures momentum by comparing a closing price to its price range over a specific period. It features two lines: %K (fast) and %D (slow), with readings above 80 considered overbought and below 20 oversold.
Crossovers within these zones—such as %K crossing above %D in oversold territory—can signal potential reversals. Traders also monitor divergences, where price and the oscillator move in opposite directions, often foreshadowing trend exhaustion.
Due to its sensitivity, the Stochastic is especially effective in sideways or choppy markets. When used on shorter timeframes, it becomes a go-to tool for scalpers and day traders looking for quick momentum shifts.
6. Volume Weighted Average Price (VWAP)
VWAP calculates the average price weighted by trading volume, making it a crucial tool for understanding where the majority of trading activity has occurred. Unlike a simple average, VWAP gives more importance to periods with higher volume, offering a more accurate picture of fair value.
Intraday traders, particularly in stocks and futures, rely on VWAP to assess market bias. Prices above VWAP suggest bullish sentiment, while those below indicate bearish control. Institutional traders often use VWAP to execute large orders without disrupting the market, making it a proxy for institutional flow.
Breakouts confirmed above or below VWAP with strong volume are considered more credible. Additionally, price pulling back to VWAP in a trend can offer high-probability entry points, especially when combined with other confirming signals.
7. Average True Range (ATR)
ATR measures market volatility by calculating the average range between high and low prices over a defined period, including gaps. Unlike directional indicators, ATR doesn’t predict price movement—it quantifies how much price is moving.
This makes ATR invaluable for risk management. Traders use it to set dynamic stop-loss levels—placing wider stops in high-volatility environments and tighter ones when the market is calm. It also aids in position sizing: higher ATR values may prompt smaller position sizes to maintain consistent risk exposure.
Swing traders and position traders often incorporate ATR into their strategy to adapt to changing market conditions. For example, during earnings season or major news events, ATR typically spikes, signaling the need for adjusted risk parameters.
Tailoring Indicators to Your Trading Style
Not all strategies benefit from the same set of tools. A scalper operating on a one-minute chart has different needs than a swing trader analyzing weekly patterns. Selecting the right indicators based on your timeframe, risk tolerance, and market focus can dramatically improve your results.
Best Indicators for Scalping
Scalping demands speed, precision, and the ability to act on fleeting opportunities. Since trades last seconds to minutes, indicators must react instantly to price changes.
The Stochastic Oscillator with shortened periods (e.g., 5, 3, 3) provides rapid overbought/oversold signals. Similarly, a fast RSI (e.g., 2-6 period) can highlight sudden momentum shifts. MACD with shorter EMAs (e.g., 5 and 13) generates quicker crossovers, ideal for fast entries.
Volume is non-negotiable in scalping. A spike in volume confirms the legitimacy of a price move, reducing the risk of false breakouts. Many scalpers overlay volume profiles or tick volume to gauge participation.
Success in scalping isn’t just about signals—it’s about execution. Combine fast indicators with tight risk management and a disciplined exit strategy to avoid turning small gains into losses.
Best Indicators for Day Trading
Day traders aim to capitalize on intraday momentum, requiring tools that balance responsiveness with reliability.
VWAP is a cornerstone, helping traders align with institutional activity and identify intraday fair value. When price trades above VWAP with strong volume, it suggests bullish control; a break below may indicate distribution.
MACD and RSI remain valuable for confirming trend direction and spotting potential reversals. For example, a bullish MACD crossover during an uptrend, supported by RSI rising from neutral territory, strengthens a long setup.
Short-term moving averages—such as the 9 and 20-period EMAs—help define the intraday trend. Price bouncing off the 9 EMA in an uptrend can signal a continuation opportunity.
Volume is again critical. Day traders often use volume bars or cumulative volume delta to validate breakouts and detect absorption at key levels.
Best Indicators for Swing Trading
Swing trading focuses on capturing multi-day to multi-week moves, requiring indicators that filter out noise and focus on sustained momentum.
Bollinger Bands help identify volatility contractions and potential breakout zones. A period of low volatility (narrow bands) followed by a strong directional move often marks the start of a new swing.
The Ichimoku Cloud, while not in the top seven, is widely used by swing traders for its comprehensive view of support, resistance, trend, and momentum—all in one indicator. When combined with Moving Averages (50, 100, 200), it offers a robust framework for trend identification.
MACD and RSI on daily charts provide confirmation of momentum strength. Divergences on higher timeframes are especially powerful, often preceding major trend changes.
Swing traders also benefit from ATR to set stop-loss levels that account for normal price fluctuations, avoiding premature exits due to market noise.
Beyond Built-in: Discovering the Best Custom TradingView Indicators (Pine Script)
While TradingView’s built-in indicators cover most foundational needs, the platform’s true strength lies in its open ecosystem powered by Pine Script. This proprietary language allows users to create, share, and customize indicators, strategies, and alerts—turning TradingView into a fully programmable analysis environment.
Custom scripts open doors to niche strategies—such as smart money concepts, order flow visualization, or machine learning-inspired filters—that aren’t available in standard tools. Many popular custom indicators combine multiple built-in functions into a single, streamlined display, reducing chart clutter while enhancing insight.
To explore, click the “Indicators” button and navigate to the “Public Library.” Here, you can search by function, asset, or author. Pay attention to user ratings, comment activity, and the author’s track record. Indicators with thousands of likes and detailed documentation are often more trustworthy.
Popular categories include:
– Advanced trend filters that adapt to market regime
– Custom divergence detectors for RSI, MACD, or Stochastic
– Buy/sell signal engines with visual alerts
– Composite indicators that blend volatility, volume, and momentum
However, caution is essential. Not all scripts are reliable—some are overfitted or poorly coded. Always backtest any custom indicator on historical data, understand its logic, and avoid blindly following signals. For curated inspiration, TradingView’s Pine Script Showcase highlights high-quality, community-vetted scripts.
Combining TradingView Indicators for Powerful Strategies
Relying on a single indicator is like navigating with one sense—possible, but risky. The real power of technical analysis comes from confluence: when multiple indicators align to confirm a single trade setup.
For example, a breakout above resistance is more convincing when:
– Volume surges on the move
– RSI exits oversold territory
– MACD shows a bullish crossover
– Price is above key moving averages
This multi-layered confirmation increases the probability of success and reduces the impact of false signals.
Effective combinations include:
– **Moving Averages + RSI**: Use MAs to define trend direction, then RSI to time entries. For instance, only take long trades when price is above the 50 EMA and RSI crosses above 40 from below.
– **MACD + Volume**: Confirm MACD crossovers with volume spikes. A bullish signal on low volume may lack conviction.
– **Bollinger Bands + Stochastic**: Look for price at the lower band with Stochastic in oversold territory for potential reversals.
But beware of overcomplication. Too many indicators create noise and lead to analysis paralysis. Stick to 2–4 complementary tools that provide different types of information—one for trend, one for momentum, one for volatility, and optionally one for volume.
Always backtest your strategy. Use TradingView’s strategy tester to simulate performance across different markets and timeframes. This ensures your indicator combination isn’t just visually appealing but statistically sound.
Optimizing Your TradingView Workspace for Indicator Efficiency
A cluttered chart slows decision-making. An organized workspace, on the other hand, enhances clarity and execution speed.
Start by saving your favorite indicator setups as templates. Once you’ve configured your moving averages, RSI, MACD, and volume settings, save them. Apply the template to any new chart with one click—ideal for scanning multiple assets quickly.
Use indicator groups to categorize tools by function—group all oscillators together, or separate trend and volatility indicators. This makes it easier to toggle visibility without removing them entirely.
Leverage layers to switch between different strategies. For example, save one layer for day trading (VWAP, short EMAs, volume) and another for swing trading (long MAs, Bollinger Bands, MACD).
Master keyboard shortcuts: Press “/” to quickly add an indicator, “H” to hide all studies, or “Ctrl + Click” to remove a single indicator. These small efficiencies add up over time.
Finally, set up alerts based on indicator conditions. Get notified when RSI crosses 70, when MACD lines crossover, or when price touches a Bollinger Band. This frees you from constant screen monitoring and ensures you never miss a key setup.
Limitations and What to Consider When Using Indicators
No indicator is foolproof. Understanding their limitations is just as important as knowing how to use them.
Most indicators are lagging—they’re based on past data and react to price changes rather than predict them. This delay can result in late entries or false signals, especially in choppy markets.
They also don’t account for fundamental shifts, news events, or macroeconomic trends. A strong earnings report or geopolitical development can override any technical signal in seconds.
Market regime matters. Momentum oscillators like RSI work well in ranging markets but generate whipsaws in strong trends. Conversely, trend-following tools like moving averages thrive in trending environments but lose effectiveness during consolidation.
Over-reliance on indicators without considering price action—such as candlestick patterns, support/resistance, or breakout structures—can lead to poor decisions. Always use indicators as a supplement, not a replacement, for core price analysis.
And above all, no tool can compensate for poor risk management. Never risk more than 1–2% of your capital per trade. Use ATR to set realistic stop-loss levels, and always define your exit strategy before entering a trade. As forex education platforms emphasize, risk management is the foundation of long-term trading success.
Conclusion: Empowering Your Trading with the Right TradingView Indicators
TradingView’s indicator suite is more than a collection of lines and histograms—it’s a dynamic toolkit for decoding market behavior. From foundational tools like Moving Averages and RSI to advanced custom scripts, these instruments empower traders to move beyond guesswork and operate with clarity and confidence.
The key to success isn’t finding a single “magic” indicator, but mastering the art of combining tools to create high-probability setups. Whether you’re scalping crypto pairs or swing trading stocks, aligning your indicators with your strategy and risk profile is essential.
Explore, experiment, and backtest. Save your best configurations. Refine your process over time. And remember: the most effective trader isn’t the one with the most indicators, but the one who uses them with discipline, context, and a clear plan.
By integrating technical tools with sound risk management and market awareness, you position yourself not just to survive the markets—but to thrive in them.
Frequently Asked Questions (FAQ)
1. What is the most accurate indicator in TradingView for predicting market movements?
There isn’t a single “most accurate” indicator that can perfectly predict market movements. All indicators are lagging to some extent, meaning they reflect past price action. The effectiveness of an indicator depends on the market conditions, the asset being traded, and your specific strategy. The best approach is to combine multiple indicators for confluence, use them in conjunction with price action analysis, and always backtest your strategy.
2. Which TradingView indicator is most effective for beginners?
For beginners, the Moving Averages (SMA & EMA) are highly effective. They are straightforward to understand, visually clear, and excellent for identifying the direction of a trend. The Relative Strength Index (RSI) is also beginner-friendly for understanding momentum and spotting overbought/oversold conditions. Start with one or two basic indicators to avoid overwhelm.
3. What are the “big 3” essential indicators every TradingView user should know?
While opinions vary, a widely accepted “big 3” would often include:
- Moving Averages (MA): For trend identification and dynamic support/resistance.
- Relative Strength Index (RSI): For momentum and overbought/oversold conditions.
- Moving Average Convergence Divergence (MACD): For confirming trend strength, momentum, and potential reversals.
These three offer a solid foundation for comprehensive technical analysis.
4. Can I find free premium indicators on TradingView, and are they reliable?
TradingView’s “Public Library” features thousands of custom indicators developed by the community using Pine Script, many of which are offered for free. Some of these can be very powerful and offer “premium” level functionality. However, reliability varies significantly. Always check the indicator’s popularity (likes), user comments, the author’s reputation, and thoroughly backtest any free custom script before relying on it for live trading.
5. What are the best TradingView indicators for identifying reliable buy and sell signals?
For identifying buy and sell signals, a combination often works best:
- MACD: Bullish/bearish crossovers of the MACD line and signal line.
- RSI: Crossing above 30 (buy) or below 70 (sell) from extreme levels, or bullish/bearish divergences.
- Bollinger Bands: Price touching the lower band (buy) or upper band (sell) combined with other confirmation.
- Moving Averages: Price crossing above/below a key MA, or MA crossovers.
Always seek confluence from multiple indicators and price action.
6. Which TradingView indicator is best suited for scalping strategies?
For scalping, indicators that are highly responsive and focus on short-term momentum are preferred. The Stochastic Oscillator (with short settings) and RSI (with short settings) are excellent for quickly identifying overbought/oversold conditions. MACD with shorter period settings can also provide quick reversal signals. These are often used in conjunction with volume for confirmation on very low timeframes.
7. How can I combine multiple TradingView indicators effectively without causing analysis paralysis?
To combine indicators effectively:
- Limit Your Number: Use 2–4 complementary indicators, not too many.
- Diversify Information: Choose indicators that provide different types of information (e.g., one for trend, one for momentum, one for volatility).
- Seek Confluence: Look for signals that align across multiple indicators.
- Backtest: Always test your combined strategy rigorously on historical data to ensure it’s effective and not over-optimized.
8. Are leading or lagging indicators generally more accurate on TradingView?
Neither type is inherently “more accurate.”
- Leading indicators (e.g., some forms of Oscillators, certain custom scripts) attempt to predict future price movements but can be prone to false signals.
- Lagging indicators (e.g., Moving Averages, MACD) confirm trends after they’ve begun, offering more reliable but delayed signals.
A balanced approach often involves using leading indicators for early alerts and lagging indicators for confirmation.
9. How do I add and customize indicators on the TradingView platform?
To add indicators, click the “Indicators” button at the top of your chart. Search for the indicator you want and click on it. To customize, hover over the indicator’s name on the chart or in the indicator list, click the gear icon (settings), and adjust parameters like period lengths, colors, and line styles. You can also save your customized settings as a template.
10. What is the difference between built-in and custom Pine Script indicators on TradingView?
Built-in indicators are standard, pre-programmed tools (like RSI, MACD, MAs) that come with TradingView. They are universally recognized and well-tested. Custom Pine Script indicators are created by the TradingView community or individual users using the Pine Script programming language. They offer unique functionalities, combine existing indicators in novel ways, or cater to niche strategies. While custom scripts provide vast possibilities, their quality and reliability can vary, requiring due diligence from the user.
留言