
What Are Renko Charts? Understanding Their Unique Construction

Renko charts provide a distinctive lens through which traders can observe market movements, standing apart from conventional time-based charting methods like candlesticks. The name “Renko” comes from the Japanese term *renga*, meaning “brick,” and this concept is central to how the charts are built—using solid blocks that represent fixed increments of price change. Unlike traditional charts that tick forward with the clock, Renko charts evolve only when price makes a significant move, creating a visual narrative focused purely on meaningful momentum. By stripping away minor fluctuations and the constraints of time, these charts offer a streamlined view of price behavior, making it easier to spot genuine trends and filter out the distractions that often cloud decision-making in volatile markets.
The Core Principle: Price Action Over Time
At the heart of Renko charting lies a simple but powerful idea: price movement matters more than the passage of time. While standard candlestick charts update every minute, hour, or day regardless of whether the market is active, Renko charts remain silent during periods of inactivity or consolidation. A new brick appears only when the price moves by a predefined amount—say, 10 points or 0.5%—in either direction. This means that hours, or even days, might pass without a single new brick if the market is range-bound, while a strong breakout could generate a rapid sequence of bricks in minutes. This approach effectively filters out market “noise,” allowing traders to focus on sustained directional moves. As a result, Renko charts are especially valuable for identifying clean trends and avoiding false signals triggered by minor price wiggles.
How Renko Charts Work: Building Blocks of Price Discovery
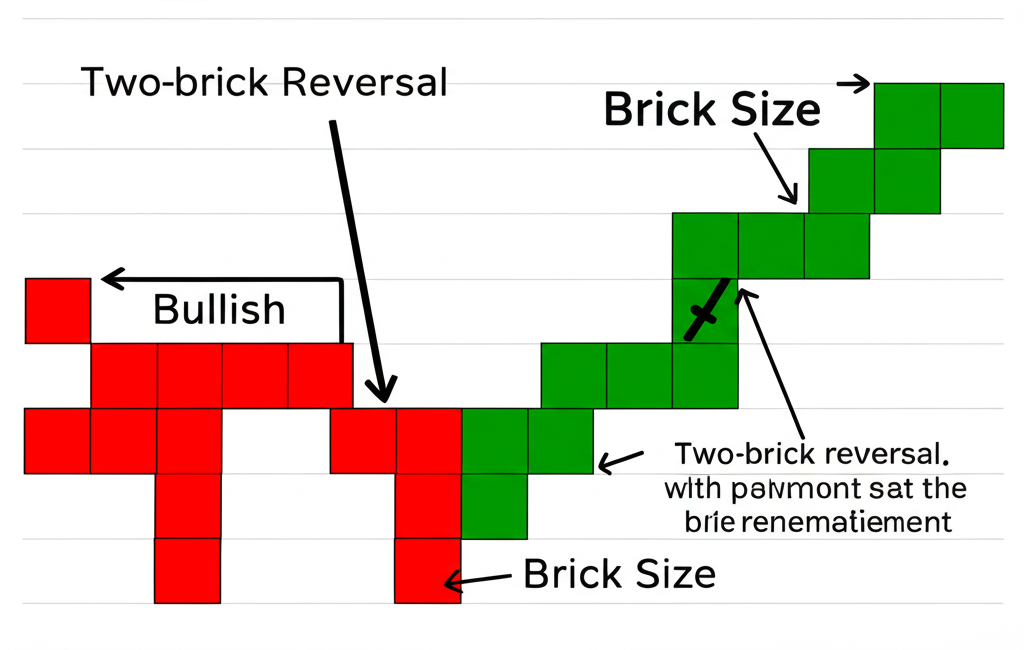
The construction of a Renko chart follows a precise set of rules that ensure each brick reflects a meaningful shift in price. When the price advances by at least the specified brick size—such as $1 for a stock or 50 pips in forex—a new bullish (typically green) brick is drawn at a 45-degree angle from the previous one. Similarly, a bearish (usually red) brick forms when price drops by the same amount. Importantly, bricks never stack vertically; they always appear diagonally offset, creating a staircase-like pattern that visually reinforces the direction of movement. One of the most critical rules governs reversals: a change in trend requires the price to move *at least two brick sizes* against the current direction before a new brick of the opposite color is plotted. For example, if the last green brick closed at $100 with a $5 brick size, a red brick won’t appear until price drops to $90. This built-in filter helps confirm that a reversal is more than just a temporary pullback, reducing the risk of whipsaws.
Understanding Renko Brick Size and Its Importance
Choosing the right brick size is perhaps the most strategic decision when using Renko charts. This single parameter shapes the entire chart’s sensitivity and usability. A smaller brick size—like 2 points on an index or 0.1% of price—will generate more bricks, capturing finer price movements and offering greater detail. However, this increased resolution comes at a cost: it reintroduces some of the volatility and false signals that Renko charts are designed to eliminate. On the other hand, a larger brick size—such as 10 points or 2x ATR—produces fewer bricks, smoothing out price action and highlighting only the most significant trends. While this enhances clarity, it also introduces lag, potentially causing traders to miss early entry points. The optimal setting depends on the asset, its volatility, and the trader’s timeframe. For instance, a day trader might use a smaller, more responsive brick, while a swing trader could prefer a larger one to stay aligned with broader market moves.
Advantages of Using Renko Charts in Trading
Renko charts bring several compelling benefits that can sharpen a trader’s edge in both trending and volatile environments:
- Effective noise reduction: By ignoring minor price swings, Renko charts help traders focus on moves that truly matter. This filtering effect is particularly useful in choppy markets, where traditional charts can create confusion with constant up-and-down motion.
- Clearer trend identification: Trends emerge with striking clarity on Renko charts. A long row of green bricks signals a strong uptrend, while a series of red bricks indicates sustained selling pressure. Reversals are equally obvious, often marked by a definitive color change after a clear two-brick shift.
- Simplified technical analysis: With fewer visual distractions, support and resistance levels become easier to identify. Chart patterns such as double tops, head and shoulders, or consolidation zones stand out more clearly, making it simpler to plan entries and exits.
- Stronger support and resistance levels: Because Renko bricks only form on significant moves, the horizontal levels they create tend to reflect true market inflection points. Minor breaches that might break a level on a candlestick chart are ignored, preserving the integrity of key zones.
Disadvantages and Limitations of Renko Charts
Despite their strengths, Renko charts are not without drawbacks, and understanding these limitations is crucial for effective use:
- Signal lag: Since a new brick only forms after a full price move, Renko charts inherently lag behind real-time price action. This delay can be problematic in fast-moving markets, where timely entries and exits are essential. Traders may find themselves reacting to moves that have already progressed significantly.
- No time or volume data: One of the trade-offs for price-focused clarity is the loss of temporal and volume context. Traders cannot see how long a brick took to form, nor can they assess the volume behind a move. This absence can weaken strategies that rely on timing, momentum confirmation, or volume spikes.
- Whipsaws in sideways markets: Even with the two-brick reversal rule, Renko charts can produce misleading signals during extended consolidation phases—especially if the brick size is too small. In such conditions, price may oscillate just enough to trigger alternating bricks, leading to a series of losing trades.
Trading Strategies with Renko Charts: Practical Applications
The clean structure of Renko charts makes them well-suited for a variety of trading approaches, particularly those centered on trend following and key level analysis:
- Trend following: One of the most straightforward strategies involves entering in the direction of the current brick sequence. A trader might go long when a new green brick forms after a downtrend ends, or short when a red brick appears following a prolonged rally. Exits can be timed with the first opposing brick, offering a clear, rule-based system.
- Support and resistance trading: The horizontal edges of Renko bricks often align with historically significant price levels. Traders can look for bounces off these zones—such as a green brick forming at a prior support level—or breakouts confirmed by a series of bricks moving beyond resistance. These patterns tend to carry more weight due to the filtering effect.
- Reversal confirmation: A shift in brick color serves as a direct signal of changing momentum. For example, after a string of green bricks, the appearance of a red brick suggests bearish control. When combined with other confirming factors—like overbought conditions or bearish divergence—this can mark a high-probability turning point.
Integrating Renko Charts with Technical Indicators
Because Renko charts filter out erratic price movements, they can enhance the reliability of many technical indicators that are prone to false signals on noisy data:
- Moving Averages (MAs): When applied to Renko charts, moving averages provide cleaner trend signals. A 20-period SMA on a Renko chart is less likely to produce whipsaws than on a candlestick chart, making crossovers more trustworthy. For instance, a price staying above the MA across multiple bricks can confirm a strong bullish bias.
- Relative Strength Index (RSI): RSI readings on Renko charts often carry more significance because they reflect momentum over sustained moves rather than short-term noise. An overbought RSI (above 70) coinciding with a new red brick can serve as a strong sell signal, while an oversold reading (below 30) with a green brick may indicate a buying opportunity.
- Moving Average Convergence Divergence (MACD): MACD divergences are particularly powerful when used with Renko charts. If price makes a new high in green bricks but the MACD shows a lower high, it suggests weakening momentum. This bearish divergence, especially when followed by a red brick, can forecast a meaningful reversal. As noted by research on Investopedia, combining MACD with other analytical tools increases its predictive accuracy.
Optimizing Your Renko Chart Settings: Finding the “Best” Brick Size
There is no universal “best” brick size—success comes from aligning the setting with market behavior and trading objectives. Traders commonly use one of three methods to determine an appropriate value:
- ATR (Average True Range) Method: This adaptive approach ties the brick size to market volatility. For example, setting the brick to 1x ATR (over 14 periods) means the chart automatically adjusts to current conditions. In high-volatility environments, bricks become larger, filtering more noise; in calm markets, they shrink slightly to maintain responsiveness. This method is favored for its dynamic nature and suitability across different market phases.
- Percentage Method: Here, the brick size is defined as a percentage of the asset’s current price—such as 0.25% or 0.5%. This ensures consistency across instruments with different price levels. For example, a 0.5% brick size would be $5 on a $1,000 stock but only $0.50 on a $100 stock, maintaining proportional relevance.
- Fixed Value Method: This involves choosing a static point value, like $0.25 for a stock or 20 pips for a currency pair. It’s simple and intuitive but less flexible. If volatility increases dramatically, the fixed brick may become too small, leading to excessive noise, or too large, causing missed opportunities.
Regardless of the method, thorough testing is essential. Traders should backtest various brick sizes using historical data to evaluate performance. A structured process might include selecting an asset (e.g., Gold or NASDAQ), defining a backtesting period, applying a strategy (like trend-following on brick color changes), and measuring outcomes such as win rate, profit factor, and drawdown. This data-driven approach helps identify the configuration that balances responsiveness with reliability.
Are Renko Charts Profitable? Debunking Myths and Setting Realistic Expectations
The idea that Renko charts alone can generate profits is a misconception. No chart type guarantees success—profitability depends on a disciplined strategy, sound risk management, and consistent execution. However, Renko charts can significantly improve decision-making by offering a cleaner, more focused view of price action. They help traders avoid emotional reactions to minor fluctuations and reduce the frequency of false signals. When used as part of a well-defined system, they can lead to higher-quality entries and exits. Yet, relying on Renko signals without considering broader market context, economic events, or risk parameters is a path to disappointment. As emphasized in analysis by Fidelity Investments, even the most sophisticated indicators require contextual understanding and careful implementation. Renko charts are a tool, not a shortcut.
Do Professional Traders Use Renko Charts? Insights from the Industry
While candlestick and line charts dominate institutional analysis, many professional traders incorporate Renko charts as a supplementary tool. They are rarely used in isolation but serve as a valuable filter within a broader analytical framework. Portfolio managers, hedge fund analysts, and algorithmic traders often turn to Renko charts for specific purposes:
- Trend confirmation: After spotting a potential trend on a time-based chart, professionals may switch to Renko to verify its strength. If the trend holds up with a clean sequence of bricks, it adds confidence to the trade idea.
- Noise reduction in volatile markets: During periods of high volatility—such as around earnings reports or macroeconomic announcements—Renko charts help separate meaningful moves from random price swings.
- Validation of key levels: The horizontal alignment of bricks makes it easier to spot strong support and resistance zones. Professionals use this to confirm levels identified through order flow, volume profiles, or Fibonacci retracements.
- Algorithmic trading applications: Some quantitative models use Renko logic to trigger entries and exits. The discrete, non-time-based nature of bricks fits well with certain pattern recognition algorithms, particularly those designed to capture sustained momentum.
In practice, Renko charts are valued not for replacing traditional tools, but for enhancing them with a unique perspective on price behavior.
How to Get and Set Up Renko Charts on Popular Platforms
Most modern trading platforms support Renko charts either natively or through add-ons. Here’s how to access them on leading systems:
- TradingView: Open a chart, click the chart type dropdown near the timeframe selector, and choose “Renko.” To customize, go to Chart Settings → Style tab, where you can select between “Traditional” (fixed value) and “ATR Based” brick sizes.
- NinjaTrader 8: Right-click on a chart, select “Data Series,” then choose “Renko” from the Type dropdown. You can set a fixed value or opt for ATR- or tick-based calculations.
- MetaTrader 4/5: Renko is not built-in, but traders can install custom indicators or Expert Advisors from the MQL5 marketplace. Once added, the indicator will overlay Renko bricks on a standard chart.
- Thinkorswim (TD Ameritrade/Schwab): Click the “Style” button on a chart, go to “Chart Type,” and select “Renko.” Brick size can be adjusted using ATR or fixed values in the settings menu.
It’s important to understand how each platform calculates bricks, as slight differences in logic—especially around reversal rules—can affect chart appearance and signal timing.
Common Mistakes to Avoid When Trading with Renko Charts
Even experienced traders can fall into traps when using Renko charts. Avoiding these pitfalls can make the difference between success and frustration:
- Neglecting market context: Focusing only on brick patterns without considering higher timeframes, macro trends, or upcoming news events can lead to misaligned trades. Renko signals should complement, not replace, broader analysis.
- Poor brick size selection: Using a size that’s too small turns the chart into a noisy replica of a candlestick chart, while one that’s too large causes excessive lag. The ideal setting evolves with market conditions and must be reviewed regularly.
- Overtrading on single signals: A color change alone is not a guaranteed entry. Always seek confirmation—whether from volume, indicators, or confluence with support/resistance—before acting.
- Skipping backtesting: Jumping into live trading without testing a Renko-based strategy on historical data is risky. Backtesting reveals how the system performs in different market environments and builds confidence.
- Misunderstanding brick logic: Failing to grasp the two-brick reversal rule or the diagonal formation pattern can lead to incorrect interpretations of price action, resulting in premature or missed trades.
Conclusion: Harnessing the Power of Renko Charts
Renko charts offer a powerful alternative to traditional time-based analysis by focusing exclusively on meaningful price movement. Their ability to strip away noise and highlight sustained trends makes them a valuable tool for traders seeking clarity in complex markets. While they come with trade-offs—such as lag and the absence of time and volume data—their benefits in trend identification, support/resistance analysis, and signal reliability are significant when used wisely. When combined with other technical tools, optimized brick settings, and a disciplined trading plan, Renko charts can elevate a trader’s decision-making process. They are not a magic formula for profits, but a sophisticated instrument that, when mastered, provides a clearer window into the true direction of price.
Frequently Asked Questions About Renko Charts
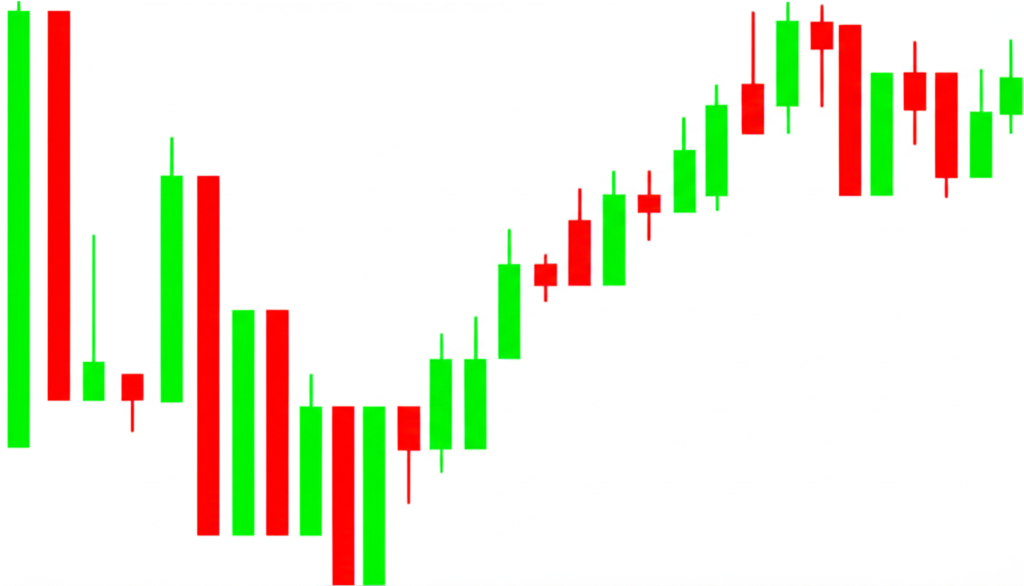
What is the main difference between Renko charts and candlestick charts?
The primary difference lies in their construction. Candlestick charts are time-based, with each candle representing a specific time period (e.g., 1 hour, 1 day), showing open, high, low, and close prices within that period. Renko charts, conversely, are price-based; new “bricks” are only formed when the price moves a predetermined amount, regardless of how long it takes. This filters out time and minor price fluctuations, focusing purely on sustained price movement.
Can Renko charts be used for all types of trading, including day trading and swing trading?
Yes, Renko charts can be adapted for various trading styles. For day trading, a smaller brick size might be chosen to capture shorter-term trends and reversals. For swing trading, a larger brick size would be more appropriate to identify longer, more significant trends and filter out intraday noise, allowing traders to hold positions for several days or weeks.
How do I determine the best brick size for Renko charts for different assets?
The “best” brick size is subjective and depends on the asset, market volatility, and your trading strategy. Common methods include:
- ATR (Average True Range) Method: Uses a multiple of the asset’s ATR for a dynamic brick size that adapts to volatility.
- Percentage Method: Sets the brick size as a percentage of the asset’s price, useful for comparing different assets.
- Fixed Value Method: A specific point value (e.g., $0.10, 10 pips).
Rigorous backtesting and experimentation with different settings on historical data for specific assets are crucial to find what works best for your approach.
Are Renko charts more profitable than other charting methods?
No charting method, including Renko charts, is inherently more profitable than others. Profitability stems from a well-defined strategy, disciplined execution, and robust risk management. Renko charts can *assist* profitability by providing clearer trend identification and noise reduction, leading to more precise signals. However, they are a tool to enhance analysis, not a guarantee of success.
Do professional traders commonly use Renko charts in their analysis?
While not as universally adopted as candlestick charts, many professional traders do use Renko charts, often as a supplementary tool. They value Renko charts for their ability to filter noise, confirm trends, validate support/resistance levels, and sometimes for specific algorithmic trading applications. Professionals typically integrate Renko charts with other forms of analysis rather than relying on them exclusively.
Which technical indicators are most effective when used with Renko charts?
Indicators that benefit from smoothed price action often work well. Examples include:
- Moving Averages (MAs): Provide clearer trend direction and crossover signals.
- Relative Strength Index (RSI): Can offer more reliable overbought/oversold signals.
- MACD (Moving Average Convergence Divergence): Helps identify momentum shifts and divergences with reduced noise.
The key is that Renko’s filtered data helps these indicators produce fewer false signals.
What are the key advantages and disadvantages of using Renko charts?
Advantages:
- Noise reduction and clearer trend identification.
- Simplified visual analysis and enhanced support/resistance levels.
Disadvantages:
- Lagging nature, potentially delaying signals.
- Lack of time and volume information.
- Can still generate whipsaws in choppy markets if brick size is not optimal.
How can I get and set up Renko charts on popular trading platforms like TradingView or NinjaTrader?
Most platforms offer Renko charts as a built-in option:
- TradingView: Go to the chart type selector and choose “Renko.” Adjust brick size in “Chart Settings” under the “Style” tab.
- NinjaTrader 8: Open a new chart, right-click, select “Data Series,” and choose “Renko” from the “Type” dropdown. Adjust “Value” or choose “ATR” for brick size.
- MetaTrader 4/5: Requires a custom Renko indicator or Expert Advisor to be installed.
Is there a specific timeframe that works best with Renko charts, or are they time-independent?
Renko charts are inherently time-independent. They don’t have traditional timeframes like 1-hour or 1-day charts. Instead, their “timeframe” is effectively determined by the chosen brick size. A smaller brick size will show more frequent price action, akin to a shorter timeframe, while a larger brick size will filter out more, similar to a longer timeframe. The formation of new bricks is solely based on price movement, not the passage of time.
What are some common mistakes to avoid when incorporating Renko charts into a trading strategy?
Common mistakes include:
- Ignoring overall market context and higher timeframes.
- Using an incorrect or unoptimized brick size.
- Over-relying on single Renko signals without confirmation from other analysis tools.
- Failing to backtest Renko-based strategies thoroughly.
- Misinterpreting the unique brick formation rules, especially for reversals.
留言