

“`html
Introduction: Navigating the High-Stakes World of Earnings Season
As traders and investors, we constantly seek opportunities within the market’s ebb and flow. Among the most powerful catalysts for significant price movements are company earnings reports. These quarterly and annual announcements provide a crucial look into a company’s financial health and future prospects, often leading to heightened volatility, increased volume, and dramatic price action. Trading earnings season isn’t for the faint of heart; it involves substantial risk, but with diligent preparation and the right strategies, it can unlock compelling opportunities.
Think of earnings season like a major weather event rolling through. Before the storm hits (the announcement), there’s often anticipation and changing atmospheric conditions (rising volatility). During the storm (the moment of release), there’s intense activity (rapid price movement, high volume). After the storm passes, conditions shift again, sometimes dramatically (IV crush, consolidation). Understanding this cycle is fundamental to successfully navigating the landscape of earnings trading.
In this comprehensive guide, we’ll explore how you, as a trader, can approach company earnings reports. We’ll delve into what makes these events such potent market movers, how to analyze the reports themselves, the critical role of volatility, and various trading strategies you can employ, from simple stock positions to sophisticated options structures. Our goal is to equip you with the knowledge to approach earnings trading with clarity and a disciplined plan.
Here are three key points to consider when trading during earnings season:
- Preparation is essential: Understand the company’s financial history, market sentiment, and analyst expectations before the earnings report.
- Volatility is common: Expect higher-than-normal volatility in stock prices as the report is released and traders react.
- Analyze guidance: Forward guidance provided by the company can significantly impact stock movements post-announcement.
| Key Metric | Definition |
|---|---|
| Revenue | Total income generated from sales and operations. |
| Net Profit | What’s left after all expenses, interest, and taxes are paid. |
| Earnings Per Share (EPS) | Net profit divided by the number of outstanding shares. |
Understanding the Catalyst: Why Company Earnings Reports Matter So Much
What exactly are company earnings reports, and why do they wield such influence over stock prices? At their core, these are mandatory financial disclosures made by publicly traded companies to the Securities and Exchange Commission (SEC). Quarterly reports are filed on Form 10-Q, while annual reports are more detailed and filed on Form 10-K. These reports aren’t just bureaucratic requirements; they are the primary way companies communicate their financial performance to shareholders and the market at large.
Within these reports, you’ll find vital data points detailing the company’s performance over the reporting period. Key metrics include:
- Revenue: The total income generated from sales and other operations. Is revenue growing year-over-year (YoY) or quarter-over-quarter?
- Gross Profit: Revenue minus the cost of goods sold. This shows the profitability of the company’s core product or service.
- Operating Profit: Gross profit minus operating expenses (like salaries, rent, marketing). This indicates profitability from core business operations before interest and taxes.
- Net Profit (or Net Income): The bottom line. What’s left after all expenses, interest, and taxes are paid. This is often the most watched number.
- Earnings Per Share (EPS): Net profit divided by the number of outstanding shares. This metric is perhaps the single most cited figure, as it directly relates a company’s profitability to a single share of stock.
- Cash Flow: Details the actual cash coming into and going out of the business. Crucial for understanding liquidity and sustainability, sometimes revealing a different picture than just net profit.
Earnings announcements are often referred to as “binary events.” This means there’s a clear, specific moment when new, significant information is released, resulting in one of a limited number of potential outcomes: the report is better than expected, worse than expected, or roughly in line with expectations. Because this information is so impactful and concentrated in time, the market reacts rapidly and intensely. This is why we see significant price gaps and bursts of trading volume immediately following the release.
The market isn’t just interested in the absolute numbers; it’s fixated on how those numbers compare to expectations. For weeks, sometimes months, leading up to the earnings release, financial analysts who cover the company publish their forecasts, creating an “analyst consensus estimate” for key metrics like EPS and Revenue. The deviation of the actual results from this consensus is a primary driver of the immediate stock price reaction. A “beat” (better than consensus) or a “miss” (worse than consensus) can trigger substantial moves. This is the essence of why trading earnings is different from typical day-to-day trading.
The Information Advantage: Analyzing Earnings Reports and Market Expectations
Successfully trading earnings season requires more than just guessing whether the numbers will be good or bad. It demands thorough due diligence and analytical rigor. Your preparation before the earnings announcement is paramount. What exactly should you be analyzing?
First, dive into the historical earnings reports for the company. How have they performed in previous quarters and years? Look for trends in Revenue growth, EPS consistency, and margin expansion or contraction. Understand the difference between GAAP (Generally Accepted Accounting Principles) and non-GAAP results. Companies often report non-GAAP figures which exclude certain items (like restructuring costs or stock-based compensation) that they argue distort the view of their core business. While GAAP is the official standard, the market sometimes focuses on non-GAAP if it provides a clearer operational picture. Be aware of what numbers analysts are using for their estimates.
Next, compare the company’s reported metrics to the analyst consensus estimates. This is the crucial benchmark for the immediate reaction. Websites and financial news services widely report these consensus figures. Did the company beat or miss on EPS? Did they beat or miss on Revenue? Often, beating on both revenue and EPS is seen as a strong positive sign, while missing on both is a strong negative. Mixed results (beating on one, missing on the other) can lead to more ambiguous initial reactions.
But don’t stop there. Look deeper. Why did they beat or miss? Was it due to exceptional one-off items? Was it driven by strong performance in their core business segments? Were there unexpected costs? Reading the management discussion and analysis section within the 10-Q or 10-K report can provide valuable context. Often, you’ll need to listen to the earnings call (or conference call) where management discusses the results and answers analyst questions. This provides qualitative color that the raw numbers don’t capture.
Finally, consider the broader market sentiment and the company’s industry or sector. Even strong earnings can be met with a muted or negative reaction if the overall market is bearish or if the company’s sector is facing headwinds. Conversely, weak earnings might not punish a stock as severely in a strong bull market. Understanding this context is vital.
Beyond the Numbers: The Importance of Forward Guidance and Analyst Consensus
While past performance is interesting, the stock market is inherently forward-looking. This is where company guidance becomes arguably the most critical piece of information released during earnings. Guidance refers to the company’s own projections for its future financial performance, typically for the next quarter and/or the full fiscal year.
Companies provide guidance on various metrics, including expected Revenue ranges, anticipated EPS ranges, capital expenditures, and sometimes specific operational targets. This guidance tells the market what management believes the future holds. Why is this so important? Because it directly impacts analysts’ future estimates. If a company reports a great quarter but issues weak guidance for the future, the stock price might fall significantly because the market is now anticipating slower growth ahead. This demonstrates the concept of information being “priced in.” If strong past performance was already expected, but weak future performance was not, the future outlook can outweigh the past results.
Similarly, consider the analyst consensus again. Before the earnings release, analysts have not only estimated the past quarter’s results but also forecast future quarters and years. When the company releases its guidance, analysts update their models and forecasts. If the company’s guidance is significantly different from the existing consensus for future periods, analysts will adjust their ratings and price targets, which can have a sustained impact on the stock price beyond the initial earnings announcement reaction.
| Considerations | Description |
|---|---|
| New Guidance | Compare the company’s new guidance to current analyst consensus for future periods. |
| Reasons Behind Guidance | Evaluate the reasons for guidance changes like new products or market challenges. |
| Analysts’ Reactions | Monitor how analysts adjust their ratings and price targets after guidance. |
Therefore, your analysis must extend beyond comparing reported EPS/Revenue to past estimates. You must carefully evaluate:
- The company’s new guidance compared to current analyst consensus for future periods.
- The reasons behind the guidance (e.g., new products, market challenges, cost controls).
- How analysts are reacting and potentially revising their ratings and price targets after the guidance is released.
Reading analyst reports published after the earnings call can provide insights into how professional money managers are interpreting the results and guidance. This layer of analysis, looking at both the past results and the future outlook as communicated by the company and interpreted by analysts, forms the foundation for developing a trading forecast.
Market’s Pulse: Volatility and Volume Dynamics During Earnings
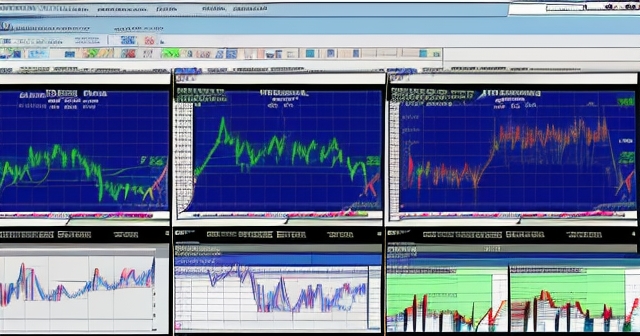
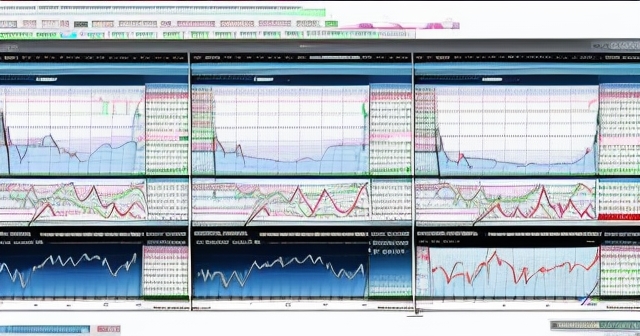
One of the defining characteristics of earnings season trading is the dramatic increase in market volatility and trading volume surrounding the announcement. Volatility, simply put, is the rate and magnitude of price changes. Leading up to earnings, uncertainty about the outcome causes market participants to become more cautious or more speculative, leading to wider price swings and less stable trading patterns compared to normal periods.
Trading volume, the number of shares or contracts traded, also surges around earnings. This is because the new information triggers a flurry of activity: existing shareholders react to the news, new traders enter positions based on their analysis, and arbitrageurs or algorithmic traders capitalize on rapid price shifts. High volume indicates strong conviction behind the price move, whether up or down.
Perhaps the most striking manifestation of this volatility is the potential for a price gap. A price gap occurs when the opening price of a stock is significantly higher or lower than the previous day’s closing price, leaving a “gap” on the chart. This is incredibly common after earnings announcements, especially if the news is a significant surprise relative to expectations. For example, if a company announces stellar results after the market closes, there may be a rush of buy orders overnight (in pre-market trading), causing the stock to open sharply higher the next morning, creating an upward gap. Conversely, bad news can lead to a downward gap.

These gaps represent both opportunity and extreme risk. If you were positioned correctly before the gap (e.g., owned the stock before an upward gap), you benefit immensely. However, if you were positioned incorrectly (e.g., shorted the stock before an upward gap), your losses can be substantial and rapid, potentially exceeding your initial capital, especially in short-selling where theoretical losses are unlimited. This inherent uncertainty and potential for gaps are why earnings trading is often considered high-risk, high-reward.
The Options Trader’s Dilemma: Decoding Implied Volatility and the Dreaded IV Crush
For options traders, understanding volatility during earnings season is not just important; it’s absolutely critical. The specific type of volatility we focus on here is Implied Volatility (IV). IV is a measure of the market’s expectation of future volatility for an underlying asset. It’s derived from the pricing of options contracts – higher IV suggests options are more expensive because traders expect bigger price swings, while lower IV means options are cheaper because smaller moves are anticipated.
Leading up to a company’s earnings announcement, Implied Volatility for that stock’s options typically spikes dramatically. Why? Because the market knows a major, potentially price-moving event is imminent. This uncertainty and the expectation of a large move are priced into the options premiums, particularly for options expiring shortly after the earnings date. The premiums on these options swell, reflecting the high IV.
Now, here’s the critical part for anyone considering *buying* options (calls or puts) before earnings: immediately after the earnings announcement occurs, regardless of how much the stock price actually moves, the uncertainty is resolved. The binary event has passed. As a result, the market’s expectation of *future* volatility for that specific catalyst drops precipitously. This phenomenon is known as “IV Crush.” The Implied Volatility collapses, often dramatically, sucking significant value out of the option’s premium.
Let’s illustrate with an analogy. Imagine you’re buying an insurance policy against a major hurricane hitting next week. As the hurricane gets closer and the forecast becomes more certain (high IV), the cost of that insurance policy (the option premium) goes up dramatically. The moment the hurricane hits or passes (the earnings announcement), the need for that specific, imminent hurricane insurance is gone, and the policy’s value (the option premium) plummets, regardless of how much damage the storm caused (the stock price move). The extrinsic value of the option, which is largely driven by IV and time until expiration, evaporates.
For options buyers, IV crush is a major headwind. Even if you correctly predict the direction of the stock move, the loss of value from IV crush can potentially offset or even exceed the gains from the price movement, especially if the move isn’t large enough. For options *sellers*, however, IV crush can be a tailwind. Strategies that involve selling options before earnings (like selling straddles or strangles, which we’ll discuss) aim to profit from the premium collected due to high IV, anticipating that the IV crush after the event will make those options cheaper to buy back or expire worthless.
Understanding IV, how it behaves around earnings, and the certainty of IV crush immediately after the event is fundamental to using options effectively in this environment. It heavily influences which options strategies are viable and how profitable (or costly) a long option position might become.
Trading Earnings Directly: The Stock Buyer vs. The Short Seller
The most straightforward way to trade a potential earnings move is by taking a direct position in the underlying stock. This involves either buying shares if you forecast a positive reaction (a “beat” on earnings and strong guidance leading to an upward move) or short selling shares if you forecast a negative reaction (a “miss” and weak guidance leading to a downward move).
If you are bullish on a company’s earnings prospects, you would buy shares of the stock before the announcement. Your maximum risk is the price you paid for the shares (they could theoretically drop to zero, though this is rare). Your potential reward is theoretically unlimited if the stock price soars. This approach is simple to understand and execute.
If you are bearish, anticipating poor results and a stock price decline, you would short sell shares. Short selling involves borrowing shares from your broker and selling them on the open market, hoping to buy them back later at a lower price and return them to the lender, pocketing the difference. If the stock price falls as you expected, you profit. However, if the stock price rises, you face increasing losses as you will have to buy the shares back at a higher price than you sold them for. As mentioned earlier, the risk in short selling is theoretically unlimited because there’s no upper limit to how high a stock price can rise. This risk is exacerbated during earnings season due to the potential for rapid, significant upward price gaps.

Trading stock directly around earnings bypasses the complexities of options (like time decay and IV crush), but it exposes you directly to the full price volatility, including potential gaps. A small position size relative to your capital is absolutely crucial if trading stock directly, especially when shorting, to manage the outsized risk of an adverse earnings surprise and gap.
Before taking a stock position, ensure your trading forecast is well-researched. Are you confident the market’s expectation (the “priced in” part) doesn’t already fully reflect your bullish or bearish view? Remember, even “good” earnings can lead to a stock falling if the market expected “great” earnings, and vice-versa.
Leveraging Earnings Moves: Basic Options Strategies (Buying Calls and Puts)
Options offer an alternative way to trade earnings, providing leverage and the ability to define your maximum risk (when buying options). The simplest options strategies for trading direction around earnings involve buying Call options if you are bullish or buying Put options if you are bearish.
A Call option gives the holder the right, but not the obligation, to buy an underlying asset at a specific price (the strike price) on or before a specific date (the expiration date). If you are bullish on an earnings outcome, you might buy a Call option with a strike price slightly above the current stock price (out-of-the-money) or at/below the current price (at-the-money or in-the-money). If the stock price surges after earnings and moves significantly above your strike price by expiration, your Call option increases in value, allowing you to sell it for a profit. Your maximum risk is limited to the premium you paid for the option.
Conversely, a Put option gives the holder the right, but not the obligation, to sell an underlying asset at a specific price (the strike price) on or before an expiration date. If you are bearish on an earnings outcome, you might buy a Put option. If the stock price drops sharply after earnings and falls significantly below your strike price by expiration, your Put option increases in value. Again, your maximum risk is limited to the premium paid.
These basic strategies offer leverage because a small movement in the stock price can lead to a much larger percentage gain (or loss) on the option premium compared to the percentage move in the stock itself. However, buying options before earnings comes with significant drawbacks, primarily due to the Volatility factor we discussed.
The high Implied Volatility before earnings makes options premiums expensive. You are paying a high price for the potential move. After the earnings announcement, the inevitable IV Crush will rapidly decrease the option’s value, regardless of the stock move. This means the stock needs to make a *very* large move in your favor, very quickly after the announcement, just to overcome the loss of extrinsic value from IV crush and time decay (Theta, another Option Greek, measures the loss of value as time passes towards expiration). If the stock move is not substantial enough, or goes in the wrong direction, you can quickly lose the entire premium paid for the option.
Therefore, while simple, buying calls or puts before earnings is a low-probability, high-reward strategy best suited for anticipating exceptionally large, rapid moves that significantly exceed what the options pricing (reflected in IV) is currently predicting.
Sophisticated Plays: Advanced Options Strategies for Earnings Volatility
Given the challenges of buying single calls or puts due to IV crush, many experienced options traders turn to multi-leg strategies designed to better manage volatility or capitalize on specific types of market reactions. These strategies are more complex but can offer defined risk, lower cost, or the ability to profit from volatility itself.
One classic strategy for earnings is the Long Straddle. This involves simultaneously buying an At-The-Money (ATM) Call and an ATM Put with the same strike price and expiration date (usually the first expiration after the earnings). This strategy is profitable if the stock makes a very large move in *either* direction after earnings. The cost is the sum of the premiums paid for the call and the put. You need the stock price to move up or down by more than this combined cost by expiration to break even. While direction-neutral initially, this strategy is heavily impacted by IV crush, as you are buying two expensive options. The move must be significant to overcome the premium cost and IV decay.
A variation is the Long Strangle. This involves simultaneously buying an Out-of-The-Money (OTM) Call and an OTM Put with the same expiration date but different strike prices (Call strike above current price, Put strike below). This is cheaper than a straddle because OTM options are less expensive. However, it requires an even larger price move to become profitable because the stock must move beyond the strike price of the respective option plus the total premium paid. Like the straddle, it profits from large moves but suffers from IV crush.
Spread Strategies (like Vertical Spreads – Bull Call Spreads, Bear Put Spreads, etc.) are frequently used for trading direction while defining both maximum risk and maximum reward. For example, a Bull Call Spread involves buying a Call option at one strike price and selling a Call option at a higher strike price, both with the same expiration. This reduces the initial cost (selling the higher strike call helps pay for the purchased call) and limits potential profit, but also limits maximum loss to the net premium paid. These strategies reduce the impact of IV crush compared to buying single options, as you are both buying and selling volatility. Spreads allow you to bet on a directional move within a certain price range.
Other spreads like Calendar Spreads or Diagonal Spreads can be used to trade volatility differences across different expiration cycles, potentially benefiting from the IV spike/crush dynamic. However, these are considerably more complex.
Finally, the Collar Strategy is often used by investors who already own shares of a stock (a long stock position) and want to protect themselves from a potential sharp downturn after earnings without selling their shares. A Collar involves owning the stock, buying a Put option (often slightly OTM) to hedge against a price drop, and selling a Call option (often OTM and above the Put strike) to help finance the cost of buying the put. This strategy limits potential upside profit (as the stock price rising above the Call strike means your Call is likely to be assigned), but it provides downside protection below the Put strike.
Choosing the right options strategy depends entirely on your trading forecast (directional vs. volatility play), your risk tolerance (defined risk vs. unlimited), and your understanding of how the options Greeks (especially Vega for volatility and Theta for time decay) will impact the position.
Essential Toolkit: Risk Management in Earnings Trading
Given the inherent volatility and potential for rapid, significant price movements, robust risk management is not optional in earnings trading; it is absolutely mandatory. Failing to manage risk properly around earnings announcements is one of the quickest ways to incur substantial losses that can severely impact your trading capital.
First and foremost is position sizing. This means determining how much capital you are willing to allocate to a single earnings trade. Because of the elevated risk, you should allocate a much smaller percentage of your total trading capital to any single earnings play compared to typical trades. A common guideline might be risking no more than 1-2% of your capital on any given trade, but for earnings, some traders might even reduce this further due to the binary, unpredictable nature of the event.
Understanding your maximum potential loss for any given strategy is crucial.
- For buying stock, your maximum loss is your investment (price paid).
- For short selling stock, your theoretical maximum loss is unlimited. This requires extreme caution and potentially placing stop-loss orders, although gaps can cause stop-losses to be executed at prices far worse than intended.
- For buying single calls or puts, your maximum loss is limited to the premium paid.
- For defined risk options spreads (like vertical spreads), your maximum loss is limited to the net premium paid (or difference in strikes minus net premium, depending on the spread type).
- For strategies like long straddles or strangles, your maximum loss is the total premium paid for the options.
- For strategies like selling naked (unhedged) options or selling straddles/strangles, your maximum potential loss can be unlimited if the market moves significantly against you. These selling strategies are generally only recommended for highly experienced traders with significant capital and a deep understanding of the risks.
Consider using stop-loss orders, but be aware of their limitations around earnings. A stop-loss order is designed to automatically close your position if the price moves beyond a certain point, limiting losses. However, due to potential price gaps after earnings announcements, your stop-loss order might not be executed at the price you set but rather at the next available price, which could be significantly worse (known as “slippage”). This is particularly true for stock positions.
Avoid impulse trading. Do not trade an earnings announcement simply because you feel pressured to participate or because you see a big move happening. Stick to your pre-defined trading plan based on your analysis. If your analysis doesn’t yield a clear forecast or if the implied volatility makes options premiums prohibitively expensive for your strategy, it’s perfectly acceptable, and often wise, to sit on the sidelines.
Monitor your positions actively. The market reaction to earnings is often immediate and dramatic. Be prepared to adjust your strategy or exit your position quickly if the market moves against you or if the anticipated volatility doesn’t materialize as expected (especially for options). This isn’t a “set it and forget it” type of trading.
Putting It All Together: Building Your Earnings Season Trading Plan
Approaching earnings season effectively requires a structured plan for each potential trade you consider. Rushing into positions based on hunches or headlines is a recipe for disappointment and losses. What does a good earnings season trading plan look like?
Step 1: Identify Potential Opportunities. Keep track of upcoming earnings announcements for companies you follow or companies known for generating significant volatility. Note the date and time of the expected release (often after market close or before market open).
Step 2: Conduct Your Due Diligence and Analysis. This is the crucial analytical phase. Review historical reports, analyze key financial metrics, compare them to analyst consensus estimates, and critically evaluate the company’s forward guidance. Listen to previous earnings calls if available. Read analyst previews and sector-specific news. Develop a clear trading forecast: do you expect the report to be significantly better than expected, significantly worse, or merely in line? What do you anticipate regarding future performance based on guidance? How much of this do you believe is already “priced in” to the current stock price?
Step 3: Assess Volatility and Risk. Look at the stock’s historical volatility (HV) and, more importantly for options, the current Implied Volatility (IV). How does the current IV compare to historical IV for this stock around earnings? Is the premium for options reflecting an expectation of a huge move, potentially making buying options less appealing due to the high cost and impending IV crush? Quantify the potential move the market is pricing in based on options prices (e.g., using a straddle price to estimate the expected move). Consider the potential price gap risk.
Step 4: Select Your Strategy. Based on your trading forecast, risk tolerance, and the volatility assessment, choose the most appropriate trading strategy.
- If you expect a huge, surprising directional move and are comfortable with defined but potentially total loss of premium: Buying Calls or Puts (understand IV crush impact!).
- If you expect a significant move but want defined risk and reward for a directional bet: Using Vertical Spreads (e.g., Bull Call Spread, Bear Put Spread).
- If you expect a very large move but are uncertain of the direction, and can afford the high premium while accepting the IV crush risk: Long Straddle or Strangle.
- If you own the stock and want to protect against downside while limiting upside: Collar strategy.
- If you have a very strong directional conviction but understand the unlimited risk: Direct Stock (Long or Short).
- If the setup isn’t compelling, or the IV is too high for your liking: Do nothing. Sometimes the best trade is no trade.
Step 5: Plan Your Position Size and Risk Management. Determine exactly how much capital you will commit to this trade and what your maximum acceptable loss is in dollar terms. Set mental or actual stop-losses (while understanding slippage risk). Know your exit criteria – at what point will you take profits or cut losses, regardless of the outcome?
Step 6: Execute and Monitor. Place your trade according to your plan. Be present and ready to monitor the position as the earnings announcement occurs and the market reacts. The initial reaction is often swift. Be prepared to react if necessary, but try to avoid emotional, unplanned decisions.
Step 7: Review and Learn. After the trade is closed (whether profitable or a loss), review what happened. Did the earnings meet your expectations? How did the market react? How did your strategy perform? What could you have done differently? This reflection is crucial for improving your earnings trading skills over time.
Conclusion: Embracing the Challenge and Opportunity of Earnings Season Trading
Trading company earnings reports is undoubtedly one of the most challenging yet potentially rewarding periods in the financial markets. These events inject a burst of volatility, volume, and potential price gaps that can lead to rapid gains or equally rapid losses. It’s a domain where thorough preparation, informed analysis, and disciplined risk management are not just encouraged but are absolutely essential for survival and success.
We’ve explored the fundamental nature of earnings reports as market catalysts, the crucial steps involved in analyzing the financials and forward guidance, the critical impact of volatility and the dreaded IV crush on options pricing, and a range of strategies from simple stock positions to more complex options structures like straddles, strangles, and spreads. Each strategy carries its own unique risk-reward profile and is suited to different market outlooks and risk appetites.
Remember, the market’s reaction to earnings is not always intuitive; it’s driven by the comparison of results and guidance against pre-existing expectations (“priced in”). Successfully navigating this requires looking beyond the headline numbers and understanding the underlying narrative and future outlook the company presents. Furthermore, the impact of related companies’ earnings or broader economic news can also influence the outcome for a specific stock.
Approaching earnings season like a seasoned professional means developing a systematic plan for each potential trade, meticulously analyzing the information, selecting a strategy that aligns with your forecast and risk tolerance, and rigorously managing your capital. It requires patience, discipline, and a deep respect for the power of these binary market-moving events. While the risks are significant, the knowledge gained from understanding and participating in earnings trading can be invaluable to your development as a trader, offering insights into market mechanics, information flow, and the dynamics of volatility that are applicable far beyond earnings season itself.
how to trade earnings seasonFAQ
Q:What is the importance of earnings reports in trading?
A:Earnings reports provide critical insight into a company’s financial health and can lead to significant stock price movements due to the market’s reaction to actual results compared to expectations.
Q:How can volatility impact trading during earnings season?
A:Volatility increases during earnings season, leading to larger price swings, which can create both opportunities and risks for traders as reactions to earnings reports unfold.
Q:What strategies can be used to trade earnings releases?
A:Traders can use a variety of strategies including direct stock purchases, options trading with calls and puts, or more advanced techniques like straddles and spreads to capitalize on expected price movements.
“`
留言