

Introduction to Heikin Ashi: The Smoother Approach to Candlesticks
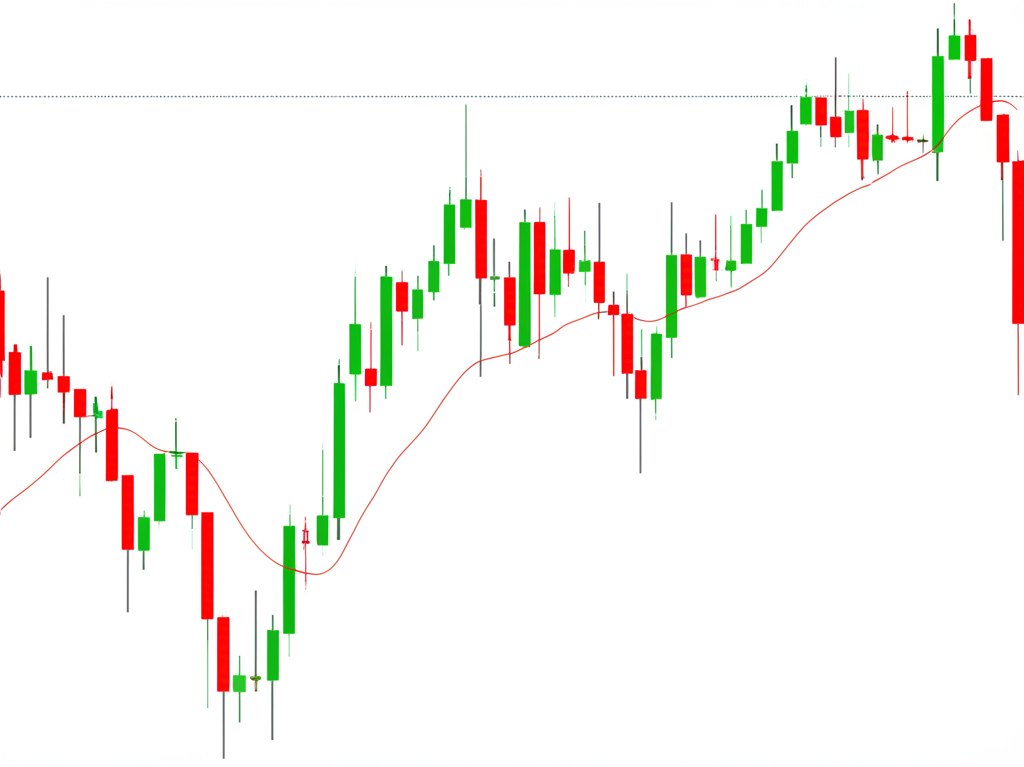
Originating in 18th-century Japan, Heikin Ashi—translated as “average bar”—offers traders a refined lens through which to view market movements. Unlike standard candlestick charts that display raw price data, Heikin Ashi applies a mathematical smoothing technique to filter out short-term volatility and emphasize the underlying trend. This method, credited to Munehisa Homma, the pioneer behind traditional candlestick analysis, recalculates each candle using averaged values from both current and prior periods. The result is a cleaner, more fluid chart that helps traders cut through the clutter of erratic price swings, especially in turbulent markets. By presenting a more coherent picture of momentum, Heikin Ashi becomes an invaluable tool for those seeking clarity in trend direction without being distracted by minor fluctuations.
Understanding Heikin Ashi: Calculation and Visual Representation
At its core, Heikin Ashi differs fundamentally from traditional candlesticks in how it constructs each price bar. While conventional charts plot the actual open, high, low, and close of a given period, Heikin Ashi uses a derived formula that blends historical and present data to produce a more stable visual pattern. This recalibration leads to longer sequences of uniformly colored candles during strong trends, reducing the visual noise caused by pullbacks and false breakouts.
The calculations are as follows:
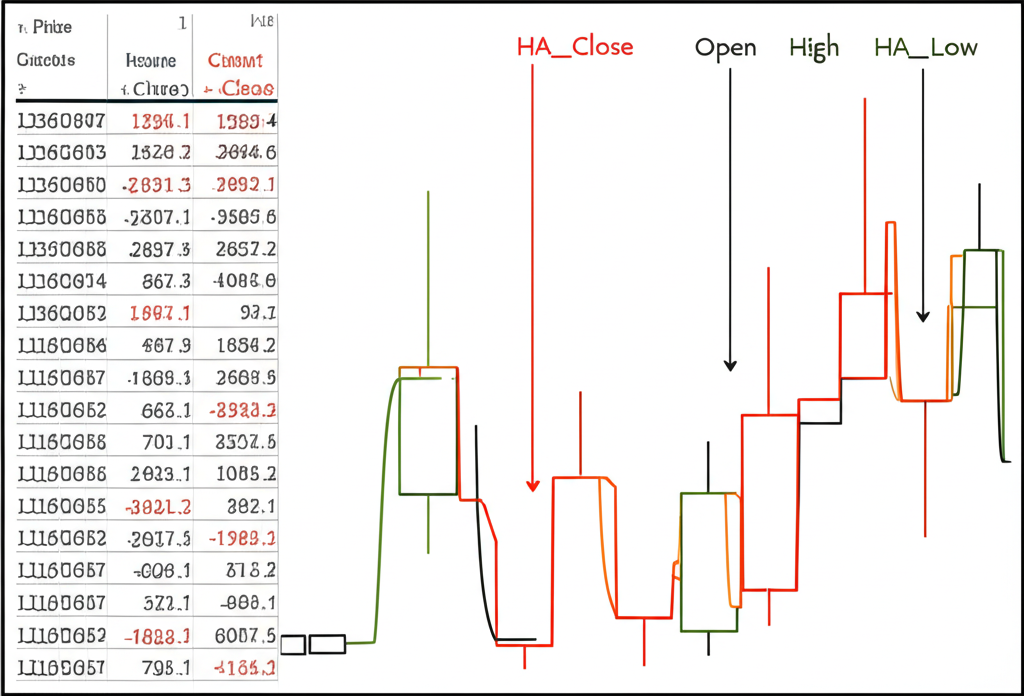
* **Heikin Ashi Close (HA_Close):** (Open + High + Low + Close) / 4
This represents the average price over the current period, smoothing out extreme values.
* **Heikin Ashi Open (HA_Open):** (Previous HA_Open + Previous HA_Close) / 2
Instead of the real opening price, this uses the midpoint of the prior Heikin Ashi candle, creating continuity between bars.
* **Heikin Ashi High (HA_High):** Maximum of (Current Period High, HA_Open, HA_Close)
Ensures the high reflects the upper boundary of the smoothed range.
* **Heikin Ashi Low (HA_Low):** Minimum of (Current Period Low, HA_Open, HA_Close)
Similarly defines the lowest point within the adjusted price zone.
Because these values are based on averages rather than exact prices, Heikin Ashi candles do not reflect precise intraday extremes or opening levels. However, this trade-off enhances readability, making it easier to distinguish between genuine trend continuation and temporary retracements. Traders often notice fewer wicks and fewer color changes during sustained moves, reinforcing confidence in the prevailing direction.
The Core Advantages and Disadvantages of Heikin Ashi

Like any technical tool, Heikin Ashi brings both strengths and drawbacks. Its ability to simplify complex price action makes it appealing, particularly for those focused on trend-following strategies. Yet, its construction inherently introduces delays and obscures fine-grained price details, requiring careful interpretation.
Advantages of Heikin Ashi
* **Enhanced Trend Clarity:** One of the most compelling benefits is the chart’s ability to visually isolate trends. Long strings of green candles without lower shadows signal persistent buying pressure, while uninterrupted red bars indicate strong selling momentum. This makes it easier to stay aligned with the dominant market direction.
* **Reduced Market Noise:** Short-term volatility and whipsaws—common pitfalls in fast-moving markets—are significantly dampened. This filtering effect allows traders to avoid knee-jerk reactions to minor price swings, supporting more deliberate decision-making.
* **Early Reversal Signals:** Despite its smoothing nature, Heikin Ashi can highlight potential turning points when candle characteristics shift. For example, a transition from large-bodied green candles to small bodies with long lower wicks may suggest weakening bullish momentum before a full reversal occurs.
* **Improved Chart Readability:** With fewer erratic movements and consistent coloring, the overall chart appears less chaotic. This visual simplicity helps traders focus on broader market structure rather than getting lost in moment-to-moment fluctuations.
* **Psychological Support:** By minimizing false signals, Heikin Ashi supports emotional discipline. Traders are less likely to exit winning positions prematurely due to volatility spikes, fostering patience and adherence to their strategy.
Disadvantages of Heikin Ashi
* **Inherent Lag:** Since each candle depends on prior data, the resulting chart lags behind real-time price action. This delay can cause entry or exit signals to appear after a move has already begun or reversed, which is particularly problematic in highly volatile or news-driven environments.
* **Loss of Price Precision:** Heikin Ashi does not show actual open, high, low, or close prices. As a result, traders relying solely on this chart type might misjudge key levels for order placement, stop-loss settings, or breakout confirmations.
* **Delayed Trend Change Detection:** In choppy or sideways markets, the indicator may continue printing candles in the previous trend’s color even after price has started reversing. This can lead to late exits or missed opportunities if used in isolation.
* **Absence of Gaps:** Traditional candlestick charts prominently display gaps, which often signal strong shifts in sentiment. Heikin Ashi typically fills these gaps due to its averaging mechanism, removing a valuable piece of technical context.
Foundational Heikin Ashi Trading Strategies for Trend Identification
Heikin Ashi shines brightest when applied to trend identification. Its design naturally amplifies directional momentum, making it ideal for traders who aim to enter early in a move and ride it for maximum gain. By learning to read candle color, wick length, and body size, market participants can build reliable rules for both entries and exits.
Heikin Ashi Trend Following Strategy: Riding the Momentum
This approach centers on capitalizing on sustained directional moves. The visual consistency of Heikin Ashi candles allows traders to remain confident in the trend, even during minor pullbacks.
* **Uptrend Identification:** A robust bullish trend appears as a sequence of green candles with minimal or no lower wicks. This formation suggests buyers consistently push prices higher, closing near the period’s peak. The absence of selling pressure is evident in the lack of lower shadows.
* **Entry Signal (Long):** Initiate long positions when multiple green candles form after a downtrend reversal or consolidation breakout. Additional confirmation can come from volume increases or alignment with key support levels.
* **Exit Signal (Long):** Begin to consider exiting or tightening stops when lower wicks reappear on green candles, or when the first red candle closes below the prior green body. A series of red candles confirms the trend shift.
* **Downtrend Identification:** A strong bearish trend manifests as consecutive red candles with little or no upper wicks. This reflects persistent selling pressure, with prices consistently closing near their lows.
* **Entry Signal (Short):** Enter short trades when a clear sequence of red candles emerges following a breakdown below support or resistance. Confirm with bearish momentum indicators if needed.
* **Exit Signal (Short):** Exit or cover shorts when upper wicks begin to appear on red candles, or when a green candle closes above the prior red body. A sustained run of green bars signals the downtrend may be ending.
Heikin Ashi Reversal Strategy: Spotting Turning Points
While designed for trend continuation, Heikin Ashi can also offer early warnings of potential reversals when interpreted carefully.
* **Signs of Trend Exhaustion:** Monitor changes in candle structure:
* In an uptrend, the emergence of longer lower wicks on green candles suggests growing selling pressure.
* In a downtrend, longer upper wicks on red candles indicate increasing buying interest.
* **Key Reversal Patterns:**
* **Small Bodies with Long Wicks (Doji or Spinning Top):** These reflect indecision. When they occur after a prolonged trend, they often precede a reversal.
* **Color Change After Indecision:** A shift from green to red following a small-bodied candle is a bearish reversal signal. The reverse holds true for bullish reversals.
* **Entry Signal:** After an uptrend, if small green candles with long lower wicks appear, followed by a red candle with long wicks and then a larger red bar, consider a short entry. Apply the opposite logic for long entries after a downtrend.
* **Stop-Loss Placement:** For reversal trades, place stop-loss orders just beyond the high of the reversal candle (for shorts) or below its low (for longs) to manage risk effectively.
Advanced Heikin Ashi Strategies: Combining for Higher Confirmation
Using Heikin Ashi in isolation can yield solid results, but its effectiveness increases dramatically when combined with complementary technical tools. Confluence—where multiple indicators align—boosts the probability of successful trades and reduces false signals.
Heikin Ashi with Moving Averages (EMA/SMA)
Moving averages provide an independent measure of trend direction and act as dynamic support or resistance zones.
* **Trend Confirmation:** Overlay a longer-term moving average (e.g., 50-period or 200-period SMA) on the Heikin Ashi chart. When candles remain above the MA and stay green, the uptrend is validated. Conversely, red candles consistently below the MA reinforce a bearish bias.
* **Entry Signals:**
* **Uptrend:** A long entry becomes more reliable when green Heikin Ashi candles emerge above a rising 20-period EMA or bounce off a longer-term SMA.
* **Downtrend:** A short entry gains strength when red candles form below a declining EMA or fail to break above a key SMA.
* **Exit Signals:**
* **Uptrend:** Exit longs when Heikin Ashi candles turn red and fall below the short-term EMA or breach the longer-term MA downward.
* **Downtrend:** Close shorts when green candles appear above the short-term EMA or break above the long-term MA.
* For further reading on how moving averages are applied in trading, Investopedia offers a comprehensive guide on various types of moving averages and their uses in technical analysis: Moving Average Explained.
Heikin Ashi with RSI or Stochastic Oscillator
Momentum oscillators help identify overbought or oversold conditions and can detect divergences that may foreshadow reversals.
* **Divergence Detection:** Watch for bearish divergence when Heikin Ashi makes a higher high but the RSI records a lower high—this suggests weakening momentum. Bullish divergence occurs when price makes a lower low but RSI forms a higher low.
* **Overbought/Oversold Confirmation:**
* **Long Entry:** In an established uptrend (green candles), a rise in RSI from below 30 (oversold) can confirm renewed buying strength.
* **Short Entry:** In a downtrend (red candles), a drop in RSI from above 70 (overbought) adds conviction to short positions.
* **Exit Signals:** When Heikin Ashi shows signs of reversal—such as shrinking bodies or color shifts—and the oscillator hits extreme levels, it strengthens the case for closing the trade.
Heikin Ashi with Support and Resistance Levels
Integrating horizontal support and resistance zones adds structural context to Heikin Ashi signals.
* **Breakouts:** A confirmed breakout occurs when Heikin Ashi candles move beyond a key resistance level with strong green bodies and no lower wicks—this supports a long entry. A breakdown below support with strong red candles signals a short opportunity.
* **Rejections:** If Heikin Ashi approaches resistance and forms small-bodied candles with long upper wicks before turning red, it indicates rejection and potential downside. The inverse applies at support.
* **Level Validation:** Use Heikin Ashi reactions to test the strength of S/R zones. Repeated color changes or momentum stalls at a level confirm its significance.
Optimizing Heikin Ashi for Various Trading Styles and Timeframes
The flexibility of Heikin Ashi allows adaptation across different trading approaches, from rapid intraday executions to long-term investment decisions. The key lies in aligning its use with the appropriate timeframe and strategic focus.
Heikin Ashi for Scalping and Day Trading
For traders operating on tight timeframes, Heikin Ashi helps identify fleeting trends and momentum bursts.
* **Timeframes:** Most effective on 1-minute, 5-minute, or 15-minute charts.
* **Strategy Focus:** Prioritize quick trend shifts—look for sharp transitions from red to green (for longs) or green to red (for shorts), especially after consolidation.
* **Confirmation Tools:** Pair with fast EMA crossovers (e.g., 9 and 21 EMA) or a 5-period Stochastic to time entries precisely.
* **Risk Management:** Given the speed of scalping, strict stop-loss placement is essential. Aim for small, frequent gains while keeping risk per trade low.
* **Caveat:** Even with smoothing, low timeframes can generate false signals. Always verify with volume or order flow data when possible.
Heikin Ashi for Swing Trading and Long-Term Positions
For traders holding positions over days or weeks, Heikin Ashi filters out daily noise and highlights major directional moves.
* **Timeframes:** Best suited for 4-hour, daily, or weekly charts.
* **Strategy Focus:** Identify structural trend changes and hold through minor corrections. The smoothing effect prevents premature exits during pullbacks.
* **Entry/Exit Rules:** Enter long when green candles dominate after a confirmed bottoming pattern. Exit when reversal signs emerge—small bodies, long wicks, or color change—on the higher timeframe.
* **Confirmation Indicators:** Combine with MACD, 50/200 SMA crossovers, or Fibonacci extensions to validate entry zones and target areas.
* **Mindset:** Requires patience. Heikin Ashi supports holding winning trades longer by maintaining visual clarity of the trend, even during drawdowns.
The Heikin Ashi “5-Rule” Blueprint: A Structured Approach to Trading
To turn theory into practice, here’s a disciplined five-rule framework that combines signal interpretation with sound risk management.
1. **Rule 1: Candle Color for Trend Direction**
Green candles indicate bullish momentum; red candles reflect bearish control. Only take long positions when candles are green, and only consider short trades when they’re red. Avoid counter-trend entries based on isolated signals.
2. **Rule 2: Wick Direction for Trend Strength**
No lower wicks on green candles = strong buying pressure. No upper wicks on red candles = strong selling pressure. Use these clean candles as high-probability entry points. Long wicks against the trend suggest weakening momentum—caution is warranted.
3. **Rule 3: Candle Body Size for Momentum**
Large bodies indicate strong momentum and conviction. Small bodies, especially with long wicks, signal indecision. Enter on large candles in the trend direction; prepare to exit when bodies shrink consistently.
4. **Rule 4: Confluence with Other Indicators (Confirmation)**
Never rely solely on Heikin Ashi. Confirm entries with moving averages, RSI, or support/resistance levels. For example, a green candle breaking resistance while RSI exits oversold territory offers much stronger validation than a standalone signal.
5. **Rule 5: Implement Robust Risk Management**
Define stop-loss and take-profit levels before entering any trade. Risk only 1–2% of your capital per position. For long entries, set stops below the low of the signal candle or recent swing low. Adjust stops upward as the trend progresses using trailing techniques. The National Futures Association (NFA) provides essential guidelines for risk management in trading, which can be found here: NFA Risk Management Advisory.
Heikin Ashi vs. Traditional Candlesticks: A Detailed Comparison
While both chart types originate from Japanese market analysis, they serve distinct purposes and offer different insights.
| Feature | Heikin Ashi Candlesticks | Traditional Japanese Candlesticks |
|---|---|---|
| Calculation | Uses averaged prices from current and previous periods (HA_Open, HA_High, HA_Low, HA_Close). | Uses actual Open, High, Low, Close prices for the current period. |
| Appearance | Smoother appearance, often shows consecutive candles of the same color during a trend. Gaps are rare. | More erratic, reflects exact price volatility. Gaps are common and significant. |
| Information Conveyed | Clearer trend direction, reduced market noise, easier to spot trend strength and reversals visually. | Precise price information (actual O, H, L, C), reflects true market volatility, useful for price action patterns. |
| Lagging Nature | Inherently lags actual price due to averaging. Signals can be delayed. | Real-time reflection of price; no lag. |
| Best Use Case | Trend identification, trend following, reducing emotional trading, filtering noise, swing trading, longer timeframes. | Precise entry/exit points, quick scalp trades, identifying exact support/resistance, analyzing specific price action patterns, all timeframes. |
| Gaps | Rarely show price gaps, as the open is based on the midpoint of the previous candle. | Clearly shows price gaps, which are important indicators of strong buying/selling pressure. |
| Wicks | Absence of wicks in one direction indicates strong trend (e.g., no lower wicks in uptrend). | Wicks represent the full range of price movement and are crucial for candlestick patterns (e.g., hammer, shooting star). |
Risk Management and Trader Psychology with Heikin Ashi
Even the most refined strategy fails without proper risk controls and emotional discipline. Heikin Ashi’s smooth visuals can positively influence trader psychology—but only if used wisely.
The indicator’s ability to suppress noise reduces anxiety caused by sharp price swings, helping traders stay in profitable trends longer. The consistent color flow during strong moves reinforces confidence, reducing the temptation to exit early out of fear. This psychological edge is one of its most underrated advantages.
However, overdependence on Heikin Ashi carries risks. Its lagging nature means it may not reflect sudden reversals quickly enough. Traders must avoid treating it as a standalone oracle.
Essential risk practices include:
* **Stop-Loss Discipline:** Always place stops. For longs, set below the entry candle’s low or a recent swing low. For shorts, place above the candle’s high. Trail stops to lock in profits as the trend evolves.
* **Position Sizing:** Limit exposure to 1–2% of total capital per trade. This ensures survivability during drawdowns.
* **Take-Profit Planning:** Define exit targets based on resistance levels, risk-reward ratios (e.g., 2:1), or reversal signals. Don’t let greed override strategy.
* **Context Awareness:** Consider the broader market environment—higher timeframe trends, economic news, and sector performance. Heikin Ashi should complement, not replace, holistic analysis.
By combining technical clarity with psychological resilience and strict risk protocols, traders can unlock the full potential of Heikin Ashi as part of a balanced trading system.
Conclusion: Maximizing Your Trading Potential with Heikin Ashi Strategy
Heikin Ashi stands out as a powerful enhancement to traditional price analysis, offering a cleaner, more intuitive view of market trends. Its ability to smooth volatility and highlight momentum makes it particularly effective for trend-following strategies across stocks, forex, crypto, and commodities. Whether used for short-term scalping or long-term position trading, it provides a visual advantage that supports better decision-making and improved emotional control.
While its lagging characteristics and lack of exact price data require caution, these limitations are manageable through strategic integration with other tools and disciplined risk management. The “5-rule” blueprint offers a practical, structured method to apply Heikin Ashi signals with confidence and consistency.
Ultimately, success with Heikin Ashi comes not from passive observation, but from active engagement—testing, refining, and combining it within a comprehensive trading plan. With practice and patience, it can evolve from a simple chart overlay into a cornerstone of a resilient and adaptive trading methodology.
Frequently Asked Questions (FAQ)
What is the best strategy for Heikin Ashi trading to identify trends?
The best strategy for identifying trends with Heikin Ashi involves observing candle color and wick patterns. A strong uptrend is indicated by a series of green Heikin Ashi candles with little to no lower wicks. Conversely, a strong downtrend is characterized by a series of red Heikin Ashi candles with little to no upper wicks. Sustained periods of these patterns signal clear trend direction and strength, making them ideal for trend-following strategies.
Which time frame is most effective when using Heikin Ashi candles for different trading styles?
- Scalping/Day Trading: For short-term strategies, 5-minute or 15-minute charts are generally effective, focusing on quick trend shifts.
- Swing Trading: 4-hour or daily charts are ideal for identifying and riding medium-term trends, as Heikin Ashi significantly reduces noise on these timeframes.
- Long-Term Positions: Weekly or monthly charts are best for identifying major, long-term trends and holding positions for extended periods. The effectiveness depends on filtering noise relevant to the holding period.
Is Heikin-Ashi a profitable trading tool, and what are its main risks and limitations?
Heikin Ashi can be a highly profitable trading tool when used correctly, primarily due to its ability to clearly identify trends and reduce market noise. However, its main risks and limitations stem from its lagging nature, as signals are based on averaged prices and can be delayed compared to real-time price action. It also doesn’t show precise price information (true high/low/open/close), which can be crucial for exact entry/exit placements. Over-reliance without combining it with other indicators and robust risk management can lead to suboptimal results.
How do Heikin Ashi candles fundamentally differ from traditional Japanese candlesticks?
The fundamental difference lies in their calculation. Traditional candlesticks show the exact open, high, low, and close prices for a given period, reflecting raw market volatility. Heikin Ashi candles, however, use averaged price data from both the current and previous periods to calculate their open, high, low, and close. This averaging creates a smoother visual representation, filters out noise, and makes trend identification easier, but at the cost of real-time price precision and showing true gaps.
Can Heikin Ashi be effectively used for high-frequency scalping strategies?
Yes, Heikin Ashi can be used for scalping, particularly on very short timeframes (e.g., 1-minute, 5-minute charts). Its ability to quickly identify micro-trends by smoothing out price action can be beneficial for rapid entry and exit. However, scalpers must be mindful of its lagging nature and always combine it with fast-moving indicators and strict stop-loss orders due to the high volatility and speed required for scalping.
What is the Heikin-Ashi “5-rule” strategy, and how should it be applied for optimal results?
The “5-rule” blueprint for Heikin Ashi trading involves:
- Candle Color: Trade in the direction of the candle color (green for long, red for short).
- Wick Direction: Look for strong trend confirmation (no lower wicks for green, no upper wicks for red).
- Candle Body Size: Use large bodies for entry, small bodies for potential exits/reversals.
- Confluence: Confirm signals with other indicators (MAs, RSI) or S/R levels.
- Risk Management: Always use stop-losses and proper position sizing.
For optimal results, apply all five rules consistently, ensuring each trade meets the established criteria before execution.
How can I combine Heikin Ashi with other technical indicators like RSI, MACD, or Moving Averages?
Combining Heikin Ashi with other indicators provides stronger confirmation and filters false signals:
- Moving Averages (MAs): Use Heikin Ashi candle color changes relative to MA crossovers or price position around MAs for trend confirmation and entry/exit signals.
- RSI/Stochastic: Confirm overbought/oversold conditions indicated by oscillators with Heikin Ashi trend changes or reversal patterns. Look for divergence between price and oscillator.
- MACD: Use MACD crossovers as a leading indicator for momentum shifts, then confirm with Heikin Ashi candle color and wick patterns.
The key is to seek confluence where multiple indicators align to provide a stronger signal.
Where can I find a reliable Heikin Ashi trading strategy PDF or a practical cheat sheet?
While specific PDFs can be found through various trading education platforms and forums, a comprehensive “cheat sheet” would typically summarize key Heikin Ashi candle interpretations (e.g., green with no lower wick = strong buy, small body with wicks = indecision/reversal) and common entry/exit rules. Many reputable financial education websites and trading blogs offer free resources, including articles and downloadable guides, that cover these essential points. Look for educational content from established brokers or financial news sites.
What are the common pitfalls and mistakes to avoid when trading with Heikin Ashi?
- Over-reliance: Not combining Heikin Ashi with other indicators or tools.
- Ignoring Lag: Forgetting that Heikin Ashi signals are smoothed and can be delayed, leading to late entries/exits.
- Lack of Risk Management: Trading without clear stop-loss and take-profit levels.
- Trading Against the Trend: Trying to pick bottoms/tops purely based on a single Heikin Ashi reversal candle without broader confirmation.
- Wrong Timeframe: Using an inappropriate timeframe for your trading style, leading to too much noise or too few signals.
Is Heikin Ashi suitable for all types of financial markets, including forex, stocks, and cryptocurrencies?
Yes, Heikin Ashi is a versatile charting technique that can be applied effectively across various financial markets, including forex, stocks, indices, commodities, and cryptocurrencies. Its core principle of smoothing price action to identify trends is universally applicable. However, traders should always adjust their strategies, timeframes, and risk management parameters to account for the specific volatility and characteristics of each market they are trading.
留言