
What is a Harmonic Pattern Indicator and Why Use It?

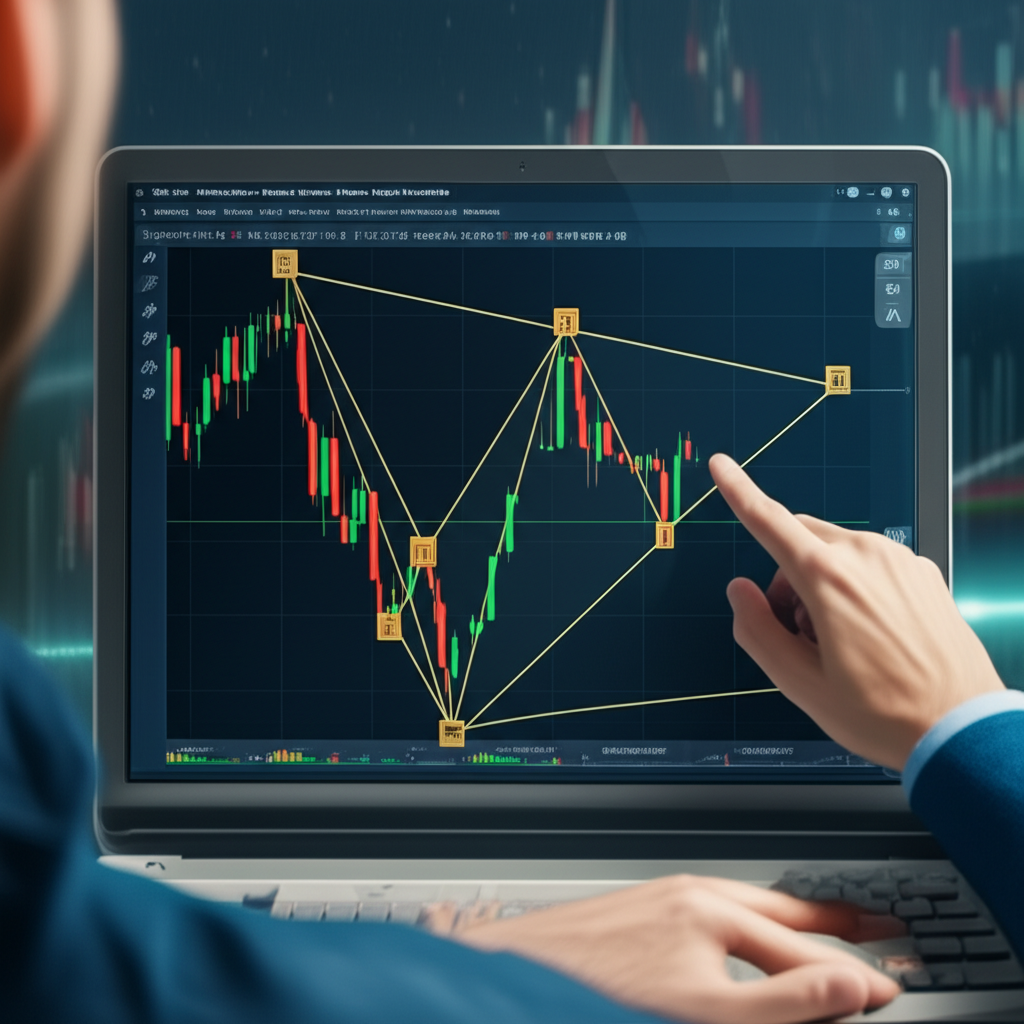
A harmonic pattern indicator is a powerful technical tool that automatically detects and draws geometric price formations on trading charts. These patterns, rooted in precise Fibonacci relationships, are widely regarded as reliable indicators of potential market turning points. Instead of manually scanning charts for complex structures, traders can rely on these indicators to highlight possible reversals in real time—freeing them from the tedious and often inconsistent process of visual identification.
The value of automation here cannot be overstated. By continuously analyzing price action, the indicator identifies key turning points—peaks and valleys—and applies strict Fibonacci calculations to determine whether a recognizable harmonic setup is forming. When the ratios align, the system overlays the pattern directly onto the chart, often marking a Potential Reversal Zone (PRZ), where price is statistically more likely to shift direction. This brings several tangible advantages: it saves hours of manual analysis, removes emotional bias, increases accuracy in pattern measurement, and delivers early warnings before major moves unfold. The foundation of harmonic trading traces back to H.M. Gartley’s 1935 work *Profits in the Stock Market*, later refined and expanded by Scott Carney, who formalized many of today’s most widely used patterns and established the rules-based methodology known as Harmonic Trading.
The Core Principles: Fibonacci Ratios and Market Harmony
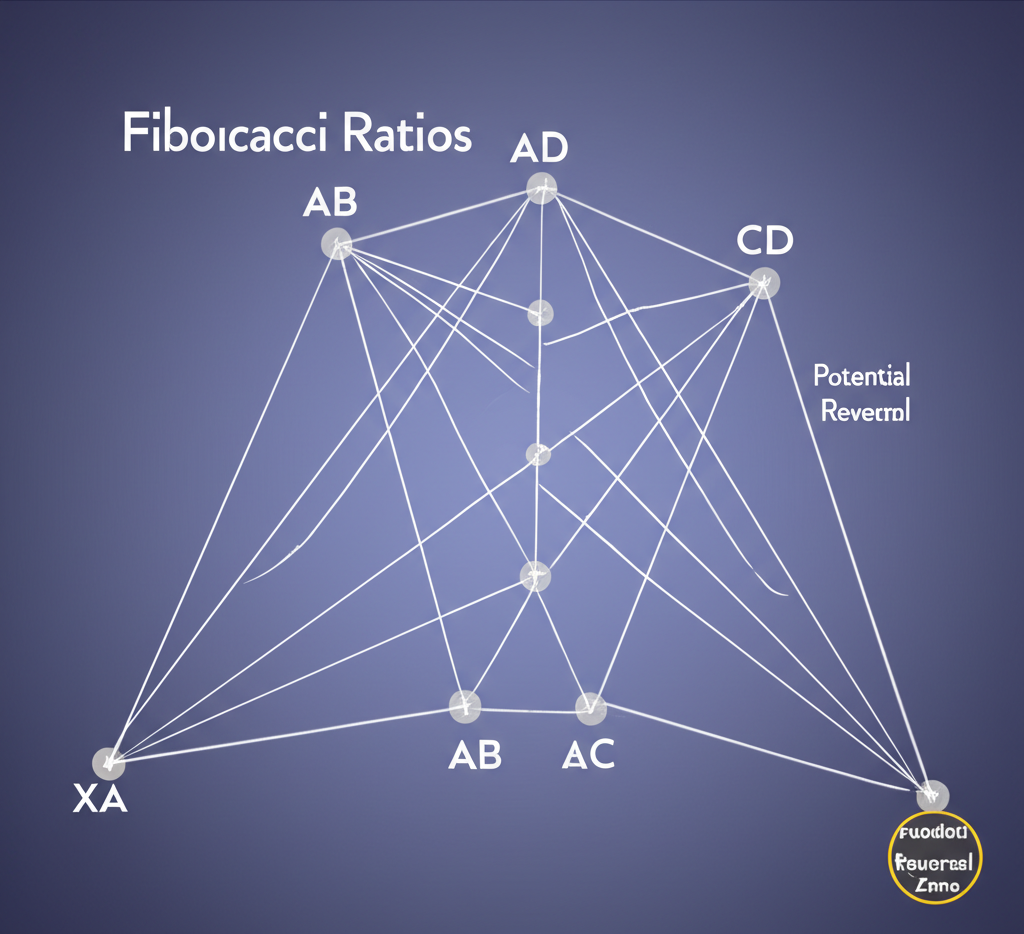
At the core of every harmonic pattern lies a deep connection to the Fibonacci sequence and its derived ratios—0.382, 0.500, 0.618, 0.786, 0.886, 1.27, 1.618, and 2.24. These numbers appear throughout nature, architecture, and financial markets, reflecting natural cycles of growth and retracement. In trading, Fibonacci levels are used to anticipate where price might stall, reverse, or accelerate based on historical momentum.
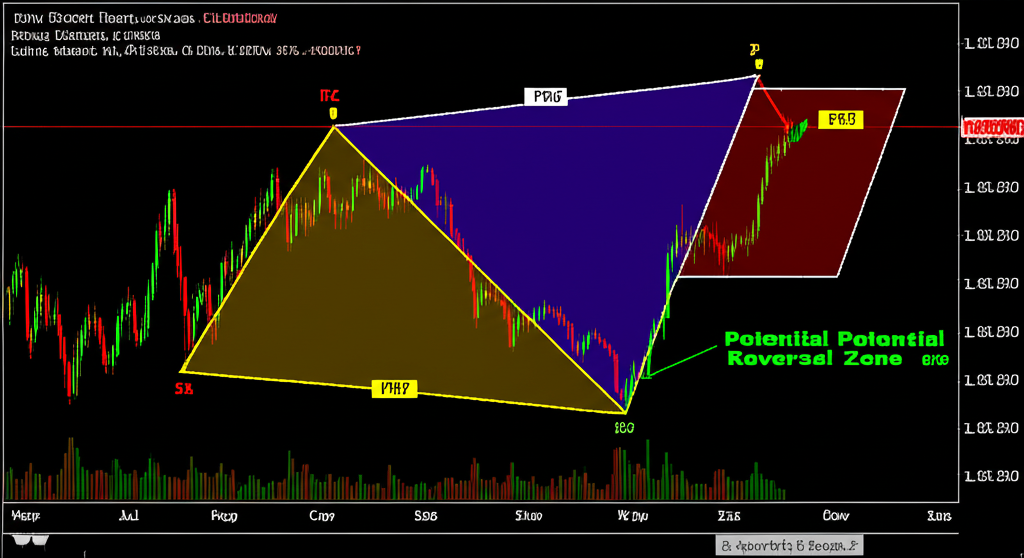
Harmonic patterns take this concept further by organizing price swings into measurable segments—labeled XA, AB, BC, and CD—each bound by specific Fibonacci proportions. For example, the AB leg might retrace exactly 0.618 of XA, while BC extends 0.886 of AB, and so on. When all legs conform to these mathematical relationships, they converge into a geometrically balanced structure, culminating in a well-defined Potential Reversal Zone (PRZ). It’s within this zone that traders watch closely for signs of reversal. The indicator’s algorithm checks each leg against these predefined ratios with surgical precision, ensuring consistency and eliminating guesswork. This mathematical rigor transforms subjective chart reading into an objective, repeatable process.
Dissecting the Most Common Harmonic Patterns
Modern harmonic indicators are programmed to recognize a variety of well-established patterns, each with its own distinct geometry and Fibonacci rules. While the automation handles detection, understanding the nuances of each pattern allows traders to assess the strength and context of the signals being generated. Below is a breakdown of the most frequently encountered formations.
Gartley Pattern
Often considered the original harmonic pattern, the Gartley appears as an “M” in downtrends (bearish) or a “W” in uptrends (bullish). It typically forms after a strong move, signaling a potential resumption of the prior trend. The AB leg pulls back 61.8% of XA, BC retraces between 38.2% and 88.6% of AB, and CD reaches the 78.6% retracement of XA. The completion point, D, also aligns with a 1.27 extension of BC. Because it often emerges during corrective phases, the Gartley is a favorite among swing traders looking to re-enter established trends.
Bat Pattern
Visually similar to the Gartley, the Bat pattern stands out due to tighter retracements and a deeper final leg. AB retraces between 38.2% and 50% of XA—shallower than the Gartley—giving it a more compressed look. BC can swing between 38.2% and 88.6% of AB, while CD extends to the 88.6% retracement of XA. The D point usually lands at a 1.618 to 2.618 extension of BC. This structure often completes earlier than the Gartley, making it a leading indicator of reversal, especially in fast-moving markets.
Butterfly Pattern
The Butterfly is a reversal pattern that typically forms at extreme price points, often marking the end of a strong trend. Unlike the Gartley, the D point extends beyond the starting X point, signaling exhaustion. AB retraces 78.6% of XA, BC corrects between 38.2% and 88.6% of AB, and CD extends to 1.27 or 1.618 times the length of XA. D also aligns with a 1.618 to 2.24 extension of BC. The fact that D surpasses X makes this pattern particularly useful for contrarian traders seeking high-probability turnarounds after overextended moves.
Crab Pattern & Deep Crab
Known for its extreme projection, the Crab pattern signals reversals from deeply overbought or oversold conditions. AB retraces between 38.2% and 61.8% of XA, BC corrects between 38.2% and 88.6% of AB, and CD extends dramatically to 1.618 times XA. The D point appears at a 2.24 to 3.618 extension of BC, making it one of the farthest-reaching patterns. The Deep Crab takes this even further: CD stretches to 2.24 or 3.618 of XA, indicating an even more stretched market. Though less common, these patterns can offer high-reward setups when confirmed with additional confluence.
Cypher Pattern
The Cypher pattern differs structurally from others. Here, point C extends beyond X, but D completes within the XA range. AB retraces 38.2% to 61.8% of XA, BC extends to 1.272–1.414 of XA, and CD retraces 78.6% of the XC leg. The PRZ forms at the 78.6% retracement of XC. This unique construction makes the Cypher especially effective in trending markets where pullbacks exhibit strong momentum before reversing. Traders appreciate its clarity and the clear alignment between price and Fibonacci confluence.
How Harmonic Pattern Indicators Function: From Code to Chart
Behind the scenes, harmonic pattern indicators operate through a multi-step algorithm designed to scan, validate, and visualize potential setups with high precision. The process unfolds in real time, adapting to new price data as it arrives:
1. **Swing Point Detection:** The algorithm scans price history to locate significant peaks and troughs—potential X, A, B, C, and D points. These are identified using volatility thresholds, price extremes, and directional changes.
2. **Fibonacci Measurement:** Once swing points are detected, the system calculates the proportional relationships between each leg. It checks AB against XA, BC against AB, and CD against both BC and XA using exact Fibonacci ratios.
3. **Pattern Recognition:** The measured ratios are compared to the strict criteria of known patterns. If the values fall within acceptable tolerance ranges for a Gartley, Bat, or other formation, the pattern is flagged as valid.
4. **Visualization and Alerts:** Upon confirmation, the indicator draws the pattern on the chart—connecting the dots, labeling each point, and shading the Potential Reversal Zone. Some systems distinguish between developing (real-time) patterns and completed ones, where price has already reacted at D.
Advanced indicators often include features such as:
– **Automatic Pattern Plotting:** Clear visual rendering of XABCD points and leg connections.
– **PRZ Highlighting:** Colored zones or horizontal bands marking the expected reversal area.
– **Real-Time Alerts:** Notifications via pop-up, sound, email, or mobile push when a pattern reaches completion.
– **Customization:** Adjustable sensitivity, pattern filters, timeframe settings, and visual preferences like colors and line styles.
– **Historical Display:** Option to view past patterns for review, strategy refinement, or educational purposes.
This blend of automation and precision transforms complex analysis into actionable insights without requiring constant screen time.
Choosing and Installing Your Harmonic Pattern Indicator
Selecting the right harmonic pattern indicator can make a meaningful difference in your trading efficiency. Not all tools are created equal—some repaint, others lack flexibility, and many fail under volatile conditions. A thoughtful selection process should consider compatibility, reliability, functionality, and community feedback.
Key evaluation factors include:
– **Platform Compatibility:** Ensure the indicator works with your preferred platform—TradingView, MetaTrader 4/5, NinjaTrader, or others.
– **Feature Set:** Look for real-time alerts, PRZ marking, multiple pattern detection, and customization options.
– **Accuracy and Repainting Behavior:** Prioritize non-repainting indicators that generate signals only with confirmed data.
– **User Feedback:** Check ratings, reviews, and discussion threads on official marketplaces or trading forums.
– **Cost vs. Value:** Free indicators can be functional, but paid versions often deliver better performance, updates, and support.
While platforms like TradingView offer built-in drawing tools for manual harmonic analysis, custom indicators automate the entire workflow, delivering faster and more consistent results. For those with coding skills, Pine Script (TradingView) or MQL (MetaTrader) allows for personal modifications and deeper control.
Harmonic Pattern Indicators for TradingView
TradingView’s cloud-based platform has become a hub for technical analysts, offering seamless access to a vast library of user-created scripts. To find a harmonic pattern indicator:
1. Click the “Indicators” button at the top of your chart.
2. Search for “harmonic patterns” or related terms.
3. Review results based on popularity, user comments, and developer credibility.
4. Click to apply the indicator to your chart.
5. Customize settings through the gear icon—adjust sensitivity, select which patterns to display, and modify colors or alert types.
One major advantage of TradingView is transparency: many harmonic indicators are open-source Pine Scripts, allowing users to inspect the logic, verify non-repainting behavior, and even tweak parameters. This openness fosters trust and enables more informed usage.
Harmonic Pattern Indicators for MetaTrader 4 (MT4) & MetaTrader 5 (MT5)
MetaTrader remains a staple for forex and CFD traders, supported by a mature ecosystem of custom indicators and Expert Advisors (EAs). Harmonic tools for MT4/MT5 typically come as compiled `.ex4` (MT4) or `.ex5` (MT5) files, though some are available as EAs with automated trade execution.
**Installation Steps:**
1. **Download** the indicator file from a trusted source (e.g., MQL5 Marketplace or developer site).
2. **Open the Data Folder:** In MT4/MT5, go to *File > Open Data Folder*.
3. **Navigate to Indicators:** Open the `MQL4` or `MQL5` folder, then go to `Indicators`.
4. **Copy the File:** Paste the `.ex4` or `.ex5` file into this folder.
5. **Refresh or Restart:** In the platform, open the *Navigator* window (Ctrl+N), right-click “Indicators,” and select *Refresh*. If the indicator doesn’t appear, restart the platform.
6. **Attach to Chart:** Drag the indicator from the Navigator onto your chart.
7. **Configure Settings:** In the input tab, adjust parameters like pattern types, alert settings, and visual elements. If the indicator uses external libraries, ensure “Allow DLL imports” is enabled under the *Common* tab.
Common issues stem from incorrect file placement or failure to refresh. Always follow the developer’s instructions, especially for indicators requiring additional files or permissions.
Trading Strategies and Risk Management with Harmonic Pattern Indicators
While harmonic indicators offer compelling reversal signals, they should never be used in isolation. To build a sustainable edge, traders must combine pattern recognition with confirmation techniques and disciplined risk controls.
**Entry Strategy:**
– **Wait for Confirmation:** Never enter a trade the moment a pattern completes. Instead, wait for price action to react within the PRZ. Strong confirmation signals include:
– **Bullish or Bearish Divergence** on RSI or Stochastic oscillators.
– **Overbought/Oversold Readings** suggesting exhaustion.
– **MACD Crossover** aligning with the reversal zone.
– **Reversal Candlesticks** such as pin bars, engulfing patterns, or hammers forming at D.
– **Confluence with Key Levels** like historical support/resistance or trendlines.
– **Optimal Timing:** The best entries often occur on the first strong reversal candle that closes beyond the PRZ boundary.
**Exit Strategy:**
– **Fibonacci-Based Targets:** Use extensions of key legs—such as 61.8% or 100% of AD, or 1.272/1.618 of BC—as profit-taking levels.
– **Multiple Targets:** Scale out of positions at different levels to secure partial profits while letting runners capture extended moves.
– **Trailing Stops:** Use ATR-based or percentage-based trailing stops to lock in gains during strong trends.
– **Risk-Reward Ratio:** Aim for at least 1:2 or 1:3, ensuring potential rewards justify the risk.
**Stop-Loss Placement:**
– For **bullish patterns**, place the stop just below the lowest point of the PRZ or below the X point.
– For **bearish patterns**, set it above the highest point of the PRZ or above X.
– Consider using **ATR (Average True Range)** to create dynamic stops that adapt to current volatility, reducing the chance of being stopped out by noise.
**Position Sizing:**
– Always risk a fixed percentage of your account per trade—typically 1% to 2%. This protects your capital during drawdowns and ensures long-term survivability. As Fidelity emphasizes, proper position sizing is critical to managing risk and avoiding catastrophic losses during inevitable losing streaks Fidelity on Risk Management.
**Combining with Broader Analysis:**
– Use harmonic patterns within the context of the larger trend. For instance, favor bullish setups in an overall uptrend and avoid counter-trend trades unless supported by strong confluence.
– Analyze higher timeframes first—daily or 4-hour charts—to establish bias, then use lower timeframes for precise entries.
Advantages, Limitations, and Common Pitfalls
Harmonic pattern indicators are among the most sophisticated tools in technical analysis, but they come with trade-offs. Understanding both their strengths and weaknesses is essential for responsible use.
**Advantages:**
– **Efficiency:** Automates detection of complex patterns, saving hours of manual chart scanning.
– **Objectivity:** Applies strict mathematical rules, removing emotional and visual bias.
– **Early Warning System:** Often identifies reversals before they become obvious, offering a strategic advantage.
– **Consistency:** Delivers repeatable results across different markets and timeframes.
**Limitations:**
– **Repainting Risk:** Some indicators redraw patterns based on future data, creating false historical signals. Only non-repainting versions should be used for live trading.
– **False Signals:** No pattern is foolproof. Markets can ignore even perfect setups, especially during news events or low liquidity.
– **Learning Curve:** While the indicator does the math, traders still need to understand pattern logic to interpret signals correctly.
– **Not a Full Trading System:** These tools identify opportunities but don’t manage trades. Users must define entries, exits, and risk parameters.
**Common Pitfalls:**
– **Overreliance:** Treating the indicator as a magic bullet leads to poor decisions. It’s a tool, not a guarantee.
– **Ignoring Context:** A valid pattern against the higher timeframe trend is often a trap. Always assess market structure Babypips on Market Structure.
– **Skipping Testing:** Deploying an untested indicator on live accounts invites losses. Backtest thoroughly across multiple assets and conditions.
– **Poor Risk Control:** Even the best signals fail. Without proper stops and position sizing, one bad trade can wipe out gains.
– **Falling for Hype:** Beware of vendors claiming 90% win rates or guaranteed profits. Real trading involves probabilities, not certainties.
Conclusion: Elevating Your Trading with Harmonic Pattern Indicators
Harmonic pattern indicators bridge the gap between advanced technical analysis and practical trading execution. By automating the detection of geometric price structures grounded in Fibonacci mathematics, they empower traders to identify high-probability reversal zones with speed and precision. From the classic Gartley to the aggressive Crab, these tools bring clarity to complex market movements.
Yet their true power emerges only when used wisely. Success lies not in blind trust, but in integrating the indicator into a complete strategy—one that includes multi-layered confirmation, strict risk management, and continuous learning. Whether you’re using TradingView’s open-source scripts or MetaTrader’s robust EAs, the goal remains the same: to make more informed, disciplined decisions. With the right approach, harmonic pattern indicators can become a cornerstone of a modern trader’s toolkit—enhancing timing, boosting confidence, and ultimately improving long-term performance.
What is the main advantage of using a harmonic pattern indicator over manual detection?
The main advantage is automation. Indicators save significant time by automatically scanning charts for complex patterns, reduce subjective bias in identification, and improve accuracy by ensuring precise Fibonacci ratio alignments, which can be challenging to spot manually.
Which harmonic patterns are most frequently identified and traded using indicators?
The most frequently identified and traded patterns include the Gartley, Bat, Butterfly, Crab, and Cypher. These patterns have well-defined Fibonacci ratios and often provide reliable reversal signals across various financial markets.
Are there any truly reliable free harmonic pattern indicators available for download on popular platforms?
Yes, many community-developed free harmonic pattern indicators are available on platforms like TradingView and through the MQL4/MQL5 marketplaces. While some can be reliable, it’s crucial to check user reviews, developer reputation, and test them thoroughly for “repainting” issues before using them for live trading. Paid versions often offer more features and dedicated support.
How do I effectively set up and configure alerts for harmonic pattern detections on my trading platform?
Most advanced harmonic pattern indicators include built-in alert features. Once the indicator is added to your chart, access its settings (usually via a gear icon or right-click). Look for an “Alerts” or “Notifications” tab/section where you can enable alerts for pattern completion, specify alert types (pop-up, sound, email, push notification), and customize conditions.
What are the common pitfalls or “repainting” issues associated with harmonic pattern indicators, and how can they be mitigated?
“Repainting” occurs when an indicator redraws or disappears patterns on historical data as new price data comes in, making a pattern that seemed valid in hindsight appear misleading in real-time. It’s a significant pitfall. To mitigate, look for “non-repainting” indicators, always confirm signals with other technical analysis tools (e.g., price action, volume, oscillators), and backtest the indicator rigorously on historical data to observe its real-time behavior.
Can harmonic pattern indicators be successfully integrated with other technical analysis tools for better trade confirmation?
Absolutely, and it’s highly recommended. Harmonic patterns should be used in conjunction with other tools for confirmation. Examples include using oscillators (RSI, Stochastics) to check for divergence or overbought/oversold conditions at the Potential Reversal Zone (PRZ), observing candlestick patterns for reversal signals, or aligning patterns with key support/resistance levels and trendlines.
What are the optimal timeframes for using harmonic pattern indicators in different trading styles?
Harmonic patterns can be effective across various timeframes. For day trading, shorter timeframes like 15-minute or 1-hour charts can be used. For swing trading, 4-hour or daily charts are often preferred. Longer timeframes generally produce more reliable patterns with fewer false signals, but also fewer trading opportunities. It’s crucial to align the timeframe with your trading style and always consider higher timeframe trends for context.
How can I backtest the historical performance of a harmonic pattern indicator before using it live?
To backtest, apply the indicator to historical data on your chosen asset and timeframe. Manually review past signals, noting entry, exit, and stop-loss placements based on your strategy. For MT4/MT5, you can use the Strategy Tester feature if the indicator is part of an Expert Advisor. For TradingView, manually scroll back on charts and observe how the indicator would have performed. Pay close attention to repainting behavior during this process.
Where can I find trustworthy user reviews or community discussions about specific harmonic pattern indicators?
Trustworthy reviews can often be found on the official marketplaces of trading platforms (e.g., MQL5.com for MetaTrader, TradingView’s script descriptions and comments section). Reputable trading forums, dedicated harmonic trading communities, and independent trading websites can also offer valuable insights and discussions from experienced users.
Do harmonic pattern indicators automatically provide entry and exit signals, or primarily focus on pattern identification?
Most harmonic pattern indicators primarily focus on pattern identification and highlighting the Potential Reversal Zone (PRZ). While some advanced indicators or Expert Advisors might suggest entry/exit points or provide trade management features, the core function is to detect and plot the pattern. Traders are typically responsible for confirming the signal, determining exact entry/exit points, and managing their risk based on their own strategy.
What are the key differences in functionality between harmonic pattern indicators for MT4 and TradingView?
MT4/MT5 indicators are typically standalone executable files (.ex4/.ex5) that run on the MetaTrader client, often offering more direct integration with automated trading (EAs). TradingView indicators are usually Pine Script-based, running directly on the web-based charting platform, benefiting from cloud execution and a vast, collaborative community script library. Both platforms offer similar core pattern detection, but the user interface, customization depth, and integration with other platform features can differ.
Is it necessary to understand Fibonacci ratios if I’m using an automated harmonic pattern indicator?
While an automated indicator handles the calculations and plotting, a fundamental understanding of Fibonacci ratios and how they define each harmonic pattern is highly beneficial. It allows you to:
- Validate the indicator’s signals.
- Better understand why a pattern is forming.
- Set more logical stop losses and profit targets.
- Identify potential false signals or weak patterns.
- Develop confidence in your trades.
In short, it moves you from blindly following a tool to intelligently leveraging it.
留言