
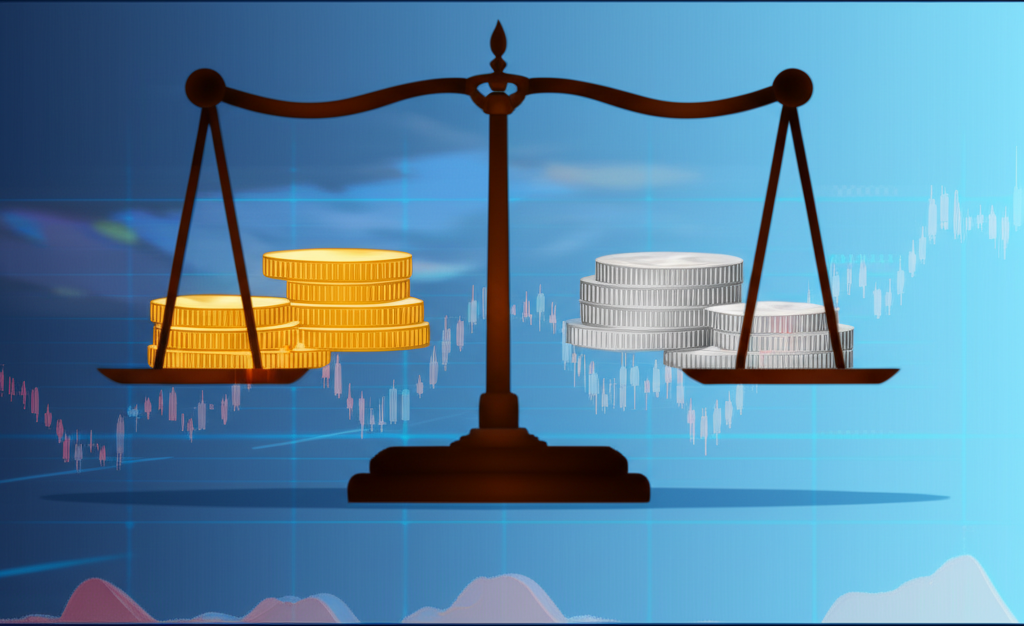
Introduction to the Gold to Silver Ratio: Your Key to Precious Metals

The gold to silver ratio is one of the most insightful tools in the world of precious metals investing. It measures how many ounces of silver it takes to buy a single ounce of gold at current market prices. While simple in concept, this metric carries deep implications for traders, investors, and analysts alike. Historically, the ratio has served as a barometer of economic sentiment, shifting with inflation, industrial demand, and market volatility. When investors see gold rising faster than silver, the ratio climbs—often signaling fear, uncertainty, or a flight to safety. When silver outpaces gold, the ratio falls, typically reflecting strong industrial growth or speculative momentum. By tracking this dynamic, market participants gain a clearer picture of whether one metal may be under- or overvalued relative to the other, helping guide strategic decisions in portfolio allocation and timing.
How the Gold to Silver Ratio Calculator Works
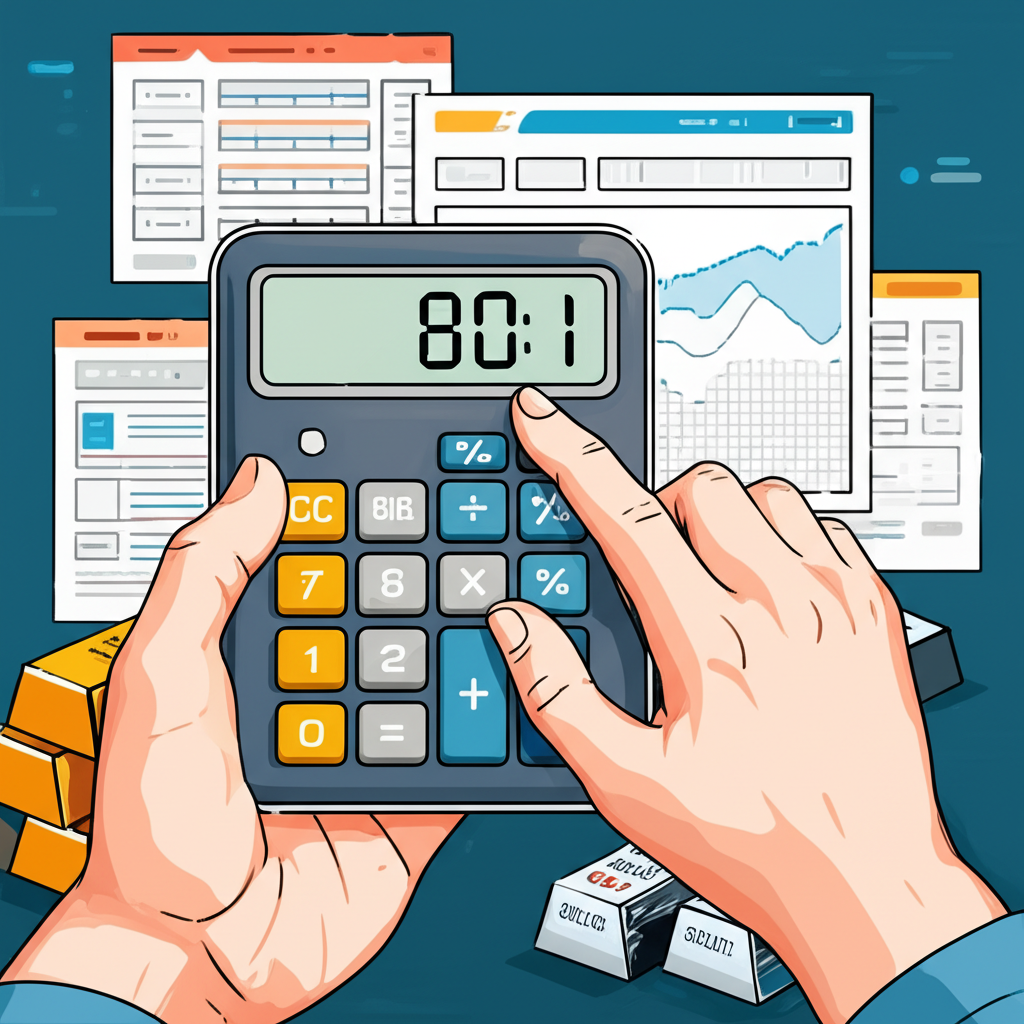
Using a gold to silver ratio calculator is both intuitive and powerful. At its core, the tool performs a straightforward mathematical operation: dividing the current spot price of gold by the spot price of silver. For example, if gold trades at $2,300 per ounce and silver at $28, the result is a ratio of approximately 82.14:1. This means you’d need over 82 ounces of silver to match the value of one ounce of gold.
Most calculators allow you to input real-time prices, usually quoted in U.S. dollars—the global benchmark for commodity markets. Once entered, the tool instantly computes the ratio, giving you an up-to-the-minute snapshot of the relationship between the two metals. More advanced versions go beyond basic calculation. They may include historical data lookup features, letting you compare today’s ratio with levels from weeks, months, or even decades ago. Some platforms also support scenario modeling, allowing you to test how changes in gold or silver prices would affect the ratio. This kind of interactive analysis helps investors anticipate shifts, evaluate potential trades, and make decisions grounded in both current data and long-term trends.
| Scenario | Gold Price (per oz) | Silver Price (per oz) | Calculated Ratio | Interpretation |
|---|---|---|---|---|
| Current Market | $2,300 | $28 | 82.14:1 | Silver relatively inexpensive compared to gold. |
| Hypothetical 1 | $2,400 | $35 | 68.57:1 | Silver gaining on gold, potentially entering a bull market. |
| Hypothetical 2 | $2,200 | $22 | 100.00:1 | Silver significantly undervalued, or gold highly overvalued. |
Interpreting the Gold to Silver Ratio: What Do the Numbers Mean?
Understanding what the gold to silver ratio tells you is essential to using it effectively. A high ratio—say, 80:1 or above—indicates that gold is expensive relative to silver. In practical terms, silver appears cheap, which may present a buying opportunity for investors who believe the relationship will eventually revert to historical norms. On the flip side, a low ratio—such as 50:1 or less—suggests that silver has become relatively expensive compared to gold. At these levels, some investors may consider shifting toward gold, anticipating that the ratio will rise again over time.
This concept hinges on the idea of mean reversion: the tendency for extreme values to eventually return to an average. While the ratio doesn’t always behave predictably, long-term trends show that it tends to oscillate within certain ranges. Recognizing whether the current level is high or low—relative to history and recent behavior—can help investors time their entries and exits more strategically. It’s not about predicting exact price movements, but rather about assessing relative value and positioning accordingly.
Historical Averages and Extremes
To make sense of today’s ratio, you need to view it through a historical lens. The gold to silver ratio has never been static. In the 18th and 19th centuries, many governments maintained bimetallic monetary systems, officially pegging the ratio around 15:1 to 16:1. These fixed rates reflected the economic importance of both metals in coinage and daily transactions.
But after the collapse of those systems, especially following the end of the gold standard in the 20th century, the ratio became far more volatile. Since then, the average has fluctuated significantly, with many analysts citing a long-term range between 50:1 and 60:1. However, the reality is more complex, with dramatic swings driven by economic cycles and global events.
During financial crises—like the 2008 recession or the market turmoil in March 2020—the ratio spiked above 100:1. In those moments, investors rushed into gold as a safe haven, while demand for silver, partly tied to industrial use, weakened. These peaks often mark periods of intense fear and capital preservation.
Conversely, the ratio has plunged during strong bull markets for precious metals. In 1980, it dropped to around 17:1 amid a surge in silver prices driven by speculation and inflation. A similar, though less extreme, dip occurred in 2011, when the ratio fell to about 32:1. These lows usually coincide with robust industrial growth, rising inflation, and heightened investor enthusiasm for commodities. Studying these extremes helps investors identify potential turning points and evaluate whether the current market environment favors accumulation or caution.
Historical Gold to Silver Ratio Chart & Trends
A visual analysis of the gold to silver ratio over time reveals clear cycles shaped by economic, geopolitical, and technological forces. While some cite a stable average near 50:1, the actual data shows a much more dynamic pattern. Over the past century, the ratio has frequently traded between 40:1 and 80:1, with sharp deviations during times of crisis or exuberance.
Key turning points stand out on a long-term chart:
* **Post-1971 (End of Bretton Woods):** When the U.S. severed the dollar’s link to gold, both metals became free-floating assets. This shift unleashed greater price volatility, leading to wider swings in the ratio.
* **1980 and 2011 Lows:** The ratio hit historic lows during major precious metals rallies. In 1980, speculation and inflation drove silver to unprecedented highs. In 2011, strong investment demand and industrial growth pushed the ratio down again.
* **Crisis-Driven Peaks:** The Dot-Com bust, the 2008 financial crash, and the 2020 pandemic all saw the ratio climb past 80:1 and, in some cases, exceed 100:1. Each time, gold outperformed silver as investors sought safety over speculation.
These patterns underscore the ratio’s role as a market sentiment gauge. When fear dominates, gold leads. When growth and optimism prevail, silver often catches up or surpasses. A well-constructed line chart makes these trends easy to spot, offering valuable context for today’s decisions. For those seeking deeper insights, the World Gold Council provides comprehensive historical data on gold prices and market behavior, allowing for detailed cross-analysis. You can explore gold price data and historical trends here.
Factors Influencing the Gold to Silver Ratio
The gold to silver ratio doesn’t move in isolation—it responds to a web of interconnected forces. Understanding these drivers allows investors to anticipate shifts rather than simply react to them. The main influences fall into several categories:
* **Supply and Demand Dynamics:**
* *Mining Supply:* Gold is typically mined in dedicated operations, making its supply more predictable. Silver, however, is often a byproduct of mining copper, lead, or zinc. This means silver output doesn’t always respond directly to changes in its own price, creating supply inflexibility.
* *Industrial Demand:* Over half of silver’s annual consumption comes from industrial uses—electronics, solar panels, medical devices, and green technology. Gold, in contrast, sees most of its demand from jewelry, investment, and central bank reserves. When manufacturing thrives, silver demand rises. When it slows, silver suffers disproportionately.
* *Investment Demand:* Both metals attract investors, but for different reasons. Gold is a traditional safe haven, often bought during uncertainty. Silver appeals to both investors and speculators due to its lower price point and higher volatility—sometimes called “poor man’s gold.”
* **Economic Conditions:**
* *Inflation:* Both metals are seen as hedges against inflation. But silver’s dual nature means it may outperform gold during inflation driven by strong economic activity.
* *Recessions:* In downturns, gold typically strengthens as a store of value, while industrial demand for silver drops, widening the ratio.
* *Interest Rates:* Rising real interest rates tend to pressure non-yielding assets. However, gold often holds up better than silver during rate hikes, especially if inflation expectations remain high.
* **Geopolitical Risk:** Wars, elections, and global instability boost gold’s appeal as a safe haven. Silver, while also a monetary metal, doesn’t benefit as consistently during these times.
* **Currency Markets:** Since gold and silver are priced globally in U.S. dollars, a stronger dollar makes them more expensive for foreign buyers, potentially dampening demand. But the impact can differ: gold is more sensitive to dollar strength due to its global reserve status, while silver’s industrial base adds another layer of complexity.
Gold’s Role vs. Silver’s Dual Role
One of the most important reasons the gold to silver ratio fluctuates so widely lies in the fundamental difference in how each metal functions in the economy. Gold is primarily a monetary asset. Central banks hold it as a reserve, investors buy it during crises, and it’s widely seen as a long-term store of value. Its price is driven less by physical consumption and more by macroeconomic fears, currency concerns, and wealth preservation.
Silver, meanwhile, has a split identity. It shares gold’s monetary and speculative appeal, but it also plays a critical role in modern industry. Its unmatched electrical conductivity and reflective properties make it essential in solar panels, circuit boards, electric vehicles, and medical instruments. This dual demand structure means silver prices respond to two distinct sets of signals: investor behavior and industrial output.
When the global economy expands, industrial demand lifts silver prices, often faster than gold. This tends to narrow the ratio. During recessions or financial stress, industrial demand weakens, but gold’s safe-haven status strengthens—widening the ratio. This contrast makes the gold to silver ratio a sensitive indicator of economic health. For detailed data on silver’s industrial footprint, the Silver Institute offers in-depth reports on global supply and demand trends. You can find detailed silver supply and demand statistics here.
Investment Strategies Using the Gold to Silver Ratio
Smart investors don’t just track the gold to silver ratio—they use it to inform real decisions. One of the most common strategies is ratio-based trading, which focuses on relative value rather than absolute price movements. The idea is simple: when the ratio is high, silver may be undervalued; when it’s low, gold may offer better value.
For instance, at a ratio of 80:1 or higher, an investor might choose to sell gold and buy silver, betting that silver will catch up. If the ratio later falls to 60:1, they could reverse the trade, locking in gains from silver’s appreciation. This approach isn’t about timing the market perfectly, but about taking advantage of recurring patterns in how the two metals interact.
Even passive investors can benefit. Instead of holding a fixed mix of gold and silver, they can rebalance periodically based on the ratio. When silver is cheap (high ratio), they allocate more to silver. When gold is cheap (low ratio), they shift toward gold. Over time, this method can increase the total number of ounces held, enhancing long-term returns without increasing overall investment.
The “80/50 Rule” for Gold to Silver Ratio: A Deep Dive
Among the most widely followed guidelines in precious metals investing is the “80/50 Rule.” This strategy uses two threshold levels to guide buying and selling decisions:
* **Above 80:1:** Suggests silver is undervalued. The rule recommends buying silver or reducing gold exposure, anticipating that the ratio will decline as silver gains strength.
* **Below 50:1:** Indicates gold may be undervalued. Investors are advised to buy gold or sell some silver, expecting the ratio to rise again.
This heuristic is rooted in decades of market behavior. Since the 1970s, the ratio has repeatedly tested the 80:1 level during crises, only to fall back as silver rebounds. Similarly, drops below 50:1 have often preceded periods where gold outperformed. For example, in early 2020, the ratio spiked past 100:1 amid pandemic panic. Investors who bought silver at that point saw strong returns as the ratio returned to the 60s within a year.
That said, the 80/50 rule isn’t a guaranteed formula. Structural changes—like shifts in industrial demand, monetary policy, or investor behavior—can keep the ratio outside these ranges for extended periods. It works best as part of a broader strategy, combined with fundamental analysis and risk management.
Integrating the Ratio into Your Precious Metals Portfolio
For long-term wealth preservation, the gold to silver ratio offers a way to refine your approach beyond simple ownership. Rather than maintaining a static allocation, you can use the ratio to dynamically adjust your holdings. Suppose your portfolio includes a 10% allocation to precious metals. Instead of splitting it evenly, you could tilt toward the metal that appears relatively cheaper at any given time.
When the ratio is elevated, increasing your silver position allows you to accumulate more ounces at lower relative cost. When it’s low, shifting toward gold lets you take advantage of its stronger safe-haven appeal. This rebalancing doesn’t require additional capital—it simply reallocates within your existing exposure.
Over time, this disciplined approach can improve performance by systematically buying low and selling high within the precious metals category. It also helps manage risk, preventing overexposure to one metal during periods of overvaluation. When paired with broader diversification principles, ratio-based rebalancing becomes a sophisticated yet accessible tool for building resilient portfolios.
Beyond USD: Gold to Silver Ratio in Global Currencies
While most discussions focus on the U.S. dollar, the gold to silver ratio can—and should—be examined in other major currencies, especially for international investors. Because the ratio compares two commodities, its intrinsic value remains consistent regardless of the currency used, as long as both metals are priced in the same one. However, the local economic context can change how the ratio is interpreted.
For example:
* **Euro (EUR):** European investors may find that a weakening euro increases the local price of gold and silver, even if USD prices are flat. This can affect perceived value and investment decisions within the Eurozone.
* **British Pound (GBP):** UK investors must consider how political events like Brexit or domestic monetary policy impact the pound’s strength, which in turn influences local precious metal prices.
* **Japanese Yen (JPY):** In Japan, a depreciating yen makes imported commodities more expensive. This can drive JPY-denominated gold and silver prices higher, affecting the local ratio even if global trends are stable.
Analyzing the ratio in multiple currencies reveals how exchange rates, inflation differentials, and regional economic policies influence metal valuations. It allows investors to make decisions that align with their local financial reality, rather than relying solely on USD-centric data. This global perspective is especially valuable in today’s interconnected markets.
Conclusion: Harnessing the Gold to Silver Ratio for Smarter Decisions
The gold to silver ratio is far more than a mathematical curiosity—it’s a strategic compass for navigating the precious metals market. By revealing the relative value of gold and silver, it reflects broader economic forces, from industrial demand to investor psychology. Understanding its historical patterns, key drivers, and strategic applications empowers investors to make more informed choices.
Whether you’re an active trader using the 80/50 rule or a long-term holder adjusting your portfolio mix, the ratio provides a framework for smarter decision-making. It encourages discipline, helps identify potential opportunities, and promotes a deeper understanding of market dynamics. When combined with global currency insights and reliable data sources, it becomes an essential tool in any investor’s toolkit. In the ever-changing landscape of finance, the gold to silver ratio remains a timeless guide to value, timing, and balance.
What is a good gold to silver ratio for investment?
There isn’t a single “good” ratio, as it depends on your investment strategy. However, historically, a ratio above 80:1 often suggests silver is undervalued relative to gold, potentially signaling a buying opportunity for silver. Conversely, a ratio below 50:1 might indicate gold is undervalued relative to silver.
How do you calculate the gold to silver ratio today?
The gold to silver ratio is calculated by dividing the current spot price of gold per ounce by the current spot price of silver per ounce. For example, if gold is $2,300/oz and silver is $28/oz, the ratio is 2300 / 28 = 82.14:1.
What does it mean when the gold to silver ratio is high or low?
A high ratio (e.g., above 80:1) means gold is expensive relative to silver, suggesting silver might be undervalued and could be a good buy. A low ratio (e.g., below 50:1) means silver is expensive relative to gold, suggesting gold might be undervalued and could be a good buy.
Did gold hit $4000 an ounce today, and how does that affect the ratio?
As of current market conditions, gold has not hit $4000 an ounce. If gold were to reach $4000/oz, and silver’s price remained constant or rose less proportionally, the gold to silver ratio would increase significantly, indicating an even greater undervaluation of silver relative to gold.
What is the 80/50 rule for the gold to silver ratio, and how is it applied?
The “80/50 rule” is an investment heuristic: when the ratio reaches 80:1 or higher, it suggests buying silver and/or selling gold. When the ratio drops to 50:1 or lower, it suggests buying gold and/or selling silver. It’s a strategy for rebalancing based on historical patterns of relative valuation.
Can the gold to silver ratio predict future market trends?
While not a definitive predictor, the gold to silver ratio is a strong indicator of relative market sentiment and economic health. Extreme high ratios often coincide with economic fear (favoring gold), while extreme low ratios can signal strong industrial growth and inflationary pressures (favoring silver). It helps anticipate potential shifts rather than precise predictions.
What is the historical gold to silver ratio over the last 100 years?
Over the last 100 years, the ratio has fluctuated widely, generally ranging from around 40:1 to over 100:1. Notable lows occurred around 17:1 in 1980 and 32:1 in 2011, while highs surpassed 100:1 during major financial crises like in 2008 and 2020. The long-term average is often cited in the 50:1 to 60:1 range.
Should I buy gold or silver when the ratio is at a certain level?
Many investors consider buying silver when the ratio is high (e.g., 80:1+) and buying gold when the ratio is low (e.g., 50:1-). This strategy aims to capitalize on the mean reversion tendency of the ratio, buying the relatively cheaper metal and selling the relatively more expensive one.
Where can I find a gold to silver ratio calculator in USD for the USA market?
Many financial websites and precious metals dealers offer real-time gold to silver ratio calculators. Look for platforms that provide live spot prices for gold and silver, typically denominated in USD, to calculate the ratio relevant to the USA market.
How does economic inflation influence the gold to silver ratio?
Both gold and silver are considered inflation hedges. However, silver, with its significant industrial demand, can sometimes outperform gold during periods of inflation driven by strong economic growth, as industrial activity typically increases. If inflation is driven by monetary debasement with weak growth, gold’s safe-haven appeal might be stronger, potentially increasing the ratio.
留言