

What is a Falling Megaphone Pattern? (The Descending Broadening Wedge)
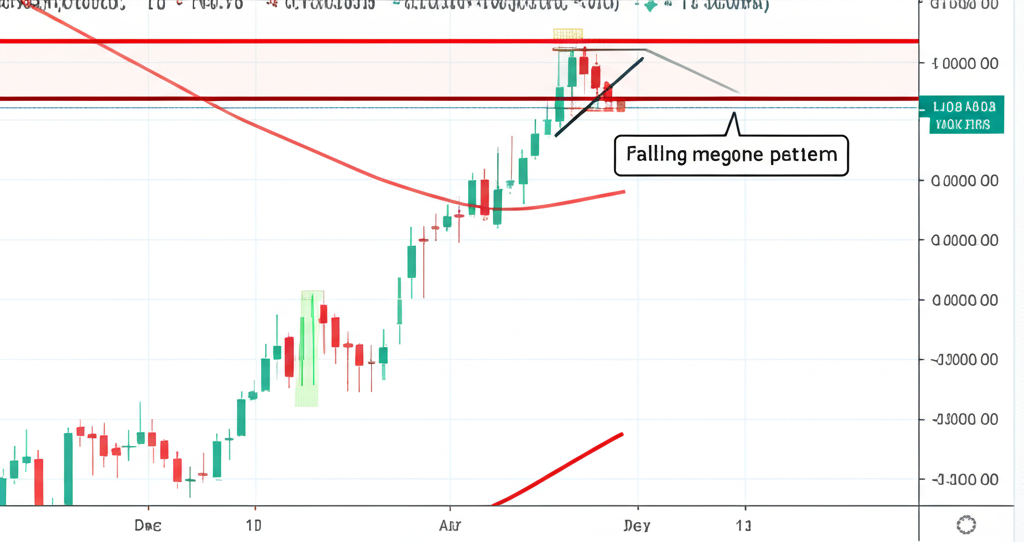
In the landscape of technical analysis, few patterns capture the tension between market forces as vividly as the falling megaphone pattern—also widely recognized as the descending broadening wedge. This formation stands apart not only for its visual distinctiveness but for what it reveals about underlying market psychology. At its core, the pattern consists of two downward-sloping trendlines that diverge over time, creating an expanding channel that envelopes price movement. Unlike consolidation patterns where volatility contracts, this structure signals growing uncertainty, with each successive swing in price exceeding the last in magnitude.
The story the chart tells begins during a sustained downtrend. Sellers remain in control, pushing prices lower, yet their dominance starts to falter. Instead of clean, decisive moves, the market produces erratic swings—lower lows followed by lower highs, but with increasing amplitude. This expansion reflects a struggle: while bears still drive the direction, buyers are stepping in more aggressively at ever-lower levels. The widening range suggests exhaustion among sellers and a buildup of buying pressure. When price finally breaks above the upper resistance line, especially with strong volume, it often marks the point where bulls seize control, setting the stage for a reversal into a new uptrend.
Key Characteristics and How to Identify the Falling Megaphone Pattern
Spotting a genuine falling megaphone pattern requires more than just recognizing a rough shape—it demands precision and an understanding of its structural anatomy. Traders who rely on superficial observations risk acting on false signals. To confirm the pattern, several key features must align.
Diverging Trendlines
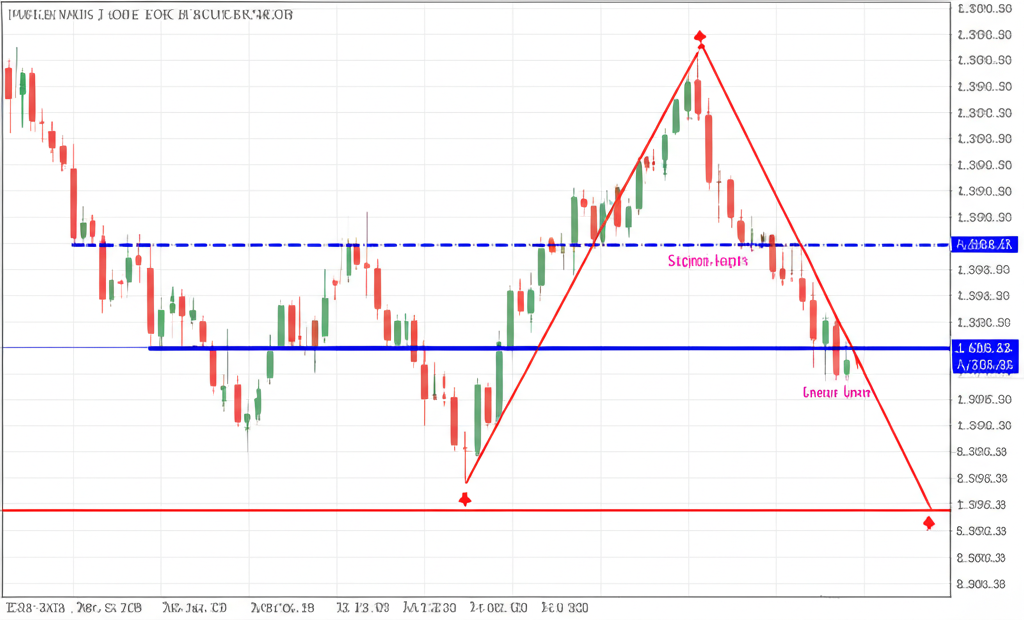
The most unmistakable trait of this formation is the pair of diverging trendlines that slope downward. The upper line connects a series of decreasing peaks—each lower than the one before—acting as dynamic resistance. The lower line traces the troughs, linking progressively lower lows and serving as temporary support. As these lines move apart, they form a cone-like shape that opens wider over time. This divergence is not random; it reflects intensifying volatility and a market in flux, where neither buyers nor sellers can establish lasting control. The expanding gap between the lines underscores growing emotional extremes—panic selling at the lows and aggressive short-covering or accumulation at the pullbacks.
Price Swings
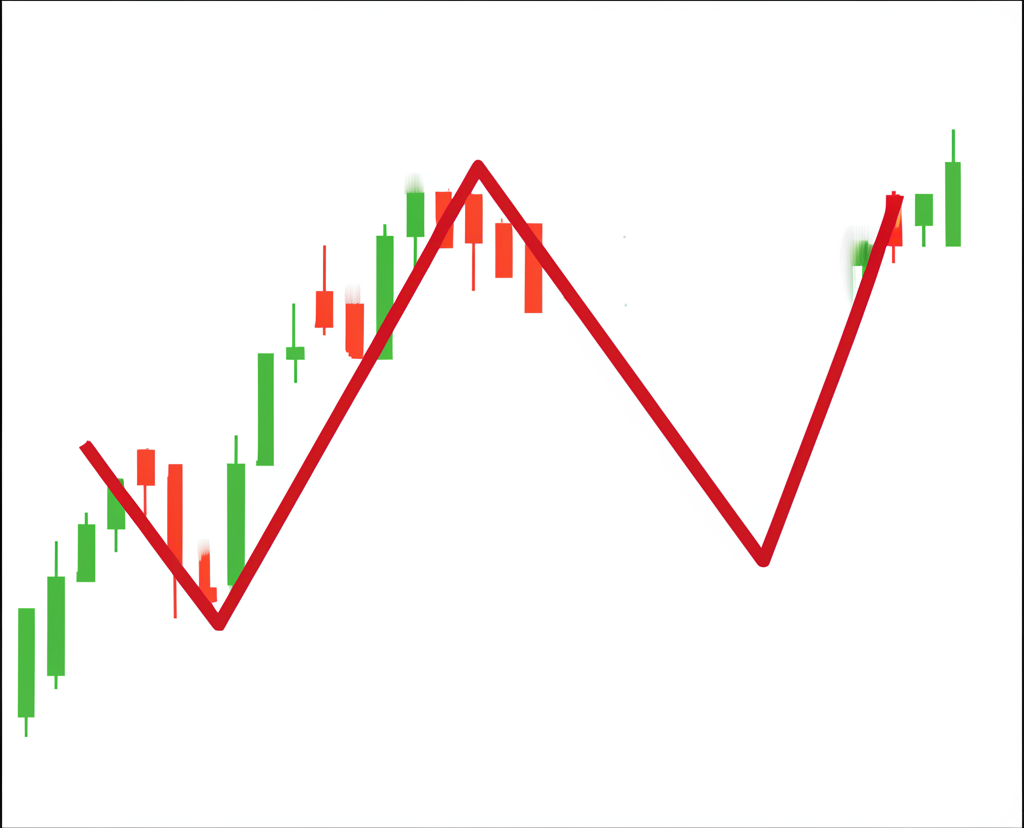
For the pattern to be valid, there must be at least two confirmed lower highs and two lower lows, forming a clear sequence: down, up (but not as high), down (lower than before), up again (still below prior highs), and so on. Each swing extends beyond the last, creating a staircase of escalating volatility. This behavior contrasts sharply with patterns like the falling wedge, where price movements tighten over time. Here, the opposite occurs—the market becomes more chaotic, a sign that sentiment is fragmenting and the old trend is losing coherence.
Volume Analysis
Volume plays a critical role in validating the narrative behind the price action. During the formation phase, volume often diminishes. This decline doesn’t indicate apathy—it signals a drying up of selling momentum. As fewer participants are willing to push prices lower, the downtrend begins to show cracks. However, the real confirmation comes at the breakout. A convincing surge in volume as price clears the upper trendline suggests institutional or strategic buyers are entering the market. This influx of capital confirms the shift in control. Without this volume spike, the breakout may lack conviction and could quickly reverse. For deeper insights into volume dynamics, refer to Investopedia’s guide to understanding trading volume.
Timeframe Considerations
While the falling megaphone can appear on any timeframe, its reliability increases on higher intervals such as daily or weekly charts. These longer timeframes filter out short-term noise and reflect broader market participation. A pattern forming over weeks or months carries more weight than one playing out over a few hours. Intraday versions can be traded, but they often require tighter stops and faster decision-making due to increased volatility and the prevalence of false breakouts. Swing traders and investors tend to place greater confidence in patterns that develop over multiple weeks, as they represent a more meaningful shift in market sentiment.
Bullish Implications: Why the Falling Megaphone Pattern Signals Reversal
The bullish signal of the falling megaphone pattern is rooted in behavioral finance. It captures the moment when a prevailing downtrend begins to unravel—not with a whimper, but with escalating conflict. Initially, sellers dominate, driving price lower with conviction. But over time, their ability to push prices down diminishes. Each new low is met with stronger buying interest, causing sharper rebounds. These countermoves grow larger, indicating that value is being perceived at lower levels.
The result is a pattern of increasing volatility and psychological strain. Traders who were short begin to cover as swings become harder to endure. New buyers, sensing opportunity, step in during pullbacks, further fueling upward momentum. This tug-of-war continues until the upper resistance is breached decisively. The breakout is not just a technical event—it’s a psychological breakthrough. It confirms that demand has overwhelmed supply and that the balance of power has shifted. Unlike bearish broadening formations such as the broadening top—which appear at market peaks and signal distribution—the falling megaphone emerges from a period of capitulation and sets the foundation for accumulation and recovery.
Step-by-Step Trading Strategies for the Falling Megaphone Pattern
Successfully trading the falling megaphone pattern requires a disciplined, multi-layered approach. While the pattern itself provides a strong directional clue, execution determines profitability. A well-structured strategy includes clear entry rules, precise stop-loss placement, realistic profit targets, and rigorous risk management.
Entry Points
Traders typically use one of two entry methods, depending on their risk tolerance:
- Aggressive Entry: Initiate a long position when price closes above the upper trendline with strong volume. This approach aims to capture the full momentum of the reversal. The breakout candle should be decisive—preferably a bullish candle with a close near its high. Waiting for the candle to close ensures the move isn’t just a fleeting spike.
- Conservative Entry: Delay entry until price retests the broken resistance level. After a breakout, it’s common for price to drift back to test the former upper trendline, which now acts as support. Entering at this level—especially if supported by a bullish reversal candle like a hammer or engulfing pattern—offers a higher-probability setup with reduced risk.
Stop-Loss Placement
Protecting capital is non-negotiable. Stop-loss levels should be placed strategically to avoid being shaken out by normal volatility while still limiting downside:
- Below the Breakout Candle’s Low: Ideal for aggressive entries, this keeps risk tight while acknowledging the breakout’s validity.
- Below the Previous Swing Low: A more forgiving stop, suitable for volatile assets or when the pattern contains deep swings. This gives the trade room to breathe without compromising the overall thesis.
- Just Inside the Upper Trendline: For retest entries, placing the stop slightly below the retested level protects against a failed breakout while accounting for minor overshoots.
Target Prices
Profit targets should reflect the pattern’s inherent potential without being overly optimistic:
- Widest Part Projection: Measure the vertical distance between the two trendlines at their broadest point. Project that distance upward from the breakout level to estimate the first target. This method accounts for the volatility expansion seen during formation.
- Previous Resistance Levels: Identify historical price zones above the breakout point where selling pressure previously emerged. These levels often act as natural barriers and provide logical exit points.
- Fibonacci Extension Levels: Apply Fibonacci extensions from the start of the prior downtrend to the first major swing high within the pattern. Levels such as 1.272, 1.618, and 2.0 often align with meaningful resistance zones.
Risk Management
No matter how compelling the setup, risk must be controlled. A standard rule is to risk no more than 1–2% of trading capital per trade. Position size should be calculated based on the distance to the stop-loss and the account size. Over-leveraging can turn a high-probability trade into a catastrophic loss. For further reading on capital preservation, explore Babypips’ guide to risk management.
Differentiating the Falling Megaphone Pattern from Similar Chart Formations
Confusing the falling megaphone with other patterns can lead to costly mistakes. While some formations look similar at a glance, their implications differ significantly.
Falling Wedge vs. Falling Megaphone
The confusion between the falling wedge and the falling megaphone is common, but the distinction is structural and behavioral:
| Feature | Falling Wedge | Falling Megaphone |
|---|---|---|
| Trendline Direction | Both sloping downwards | Both sloping downwards |
| Trendline Relationship | Converging (getting closer) | Diverging (spreading apart) |
| Volatility | Decreasing | Increasing |
| Price Swings | Smaller, tighter swings | Larger, expanding swings (lower lows, lower highs) |
| Implication | Bullish reversal (stronger signal) | Bullish reversal (can be more volatile) |
The falling wedge reflects a cooling market—a period of consolidation after a sharp decline. The narrowing range suggests sellers are losing steam. In contrast, the falling megaphone reflects a heating market—growing conflict and emotional extremes. Both lead to bullish outcomes, but the path differs: one through calm, the other through chaos.
Bearish Flag/Pennant vs. Falling Megaphone
Bearish flags and pennants are continuation patterns. They form after a strong downward move and represent a brief pause before the trend resumes. Their trendlines converge or run parallel, and volume typically drops during formation, resuming on the downside breakout. The falling megaphone, however, appears at the end of a downtrend and signals reversal. Its expanding range and upward breakout are incompatible with continuation logic.
Ascending vs. Descending Broadening Formations
The direction of the trendlines determines the pattern’s bias. The falling megaphone (descending broadening wedge) has downward-sloping, diverging lines and is bullish. Its counterpart—the ascending broadening formation (or rising megaphone)—features upward-sloping, diverging trendlines and is bearish. This pattern typically forms after an uptrend and signals a top, where increasing volatility and failed new highs precede a reversal downward. Recognizing this inverse relationship is key to avoiding directional errors.
Common Mistakes and Advanced Confirmation Techniques
Even experienced traders can misread the pattern. Avoiding common pitfalls and applying advanced filters can dramatically improve success rates.
Misidentification
One of the biggest errors is drawing trendlines too early. A single lower high and low do not constitute a pattern. At least two touchpoints for each trendline are required to establish validity. Additionally, trendlines should connect actual price extremes—not approximated points. Sloppy drawing leads to false signals and premature entries.
Ignoring Volume
Volume is not optional—it’s a confirmation tool. A breakout without volume may simply be a trap. Declining volume during formation shows weakening bearish conviction, while a surge on breakout confirms fresh buying interest. Traders who ignore this are essentially trading blind.
Lack of Confirmation
Using the pattern in isolation increases risk. Always seek corroboration. A bullish reversal signal gains strength when supported by other technical cues. Relying solely on visual patterns exposes traders to noise and false moves.
Confirmation with Oscillators
Momentum indicators like the RSI or Stochastic Oscillator can provide early warnings of reversal. Bullish divergence—where price makes a new lower low but the oscillator forms a higher low—suggests bearish momentum is fading. This hidden strength often precedes the breakout and adds confidence to the trade setup.
Multi-Timeframe Analysis
Zooming out can clarify ambiguity. If a falling megaphone appears on a daily chart, check the weekly for context. Is the broader trend also showing signs of reversal? Conversely, a 4-hour chart can help pinpoint entry after the breakout. Alignment across timeframes increases the probability of success and reinforces the trade’s validity.
Historical Performance and Backtesting Insights
The falling megaphone pattern has a documented track record in technical literature. Analysts like Thomas Bulkowski, in his comprehensive “Encyclopedia of Chart Patterns,” have studied the statistical performance of broadening formations. While exact success rates vary by market and timeframe, these patterns often outperform random chance when properly confirmed. The key is not just identification, but context—volume, momentum, and market structure all influence outcomes.
Backtesting this pattern across different assets—stocks, forex, or commodities—can yield valuable insights. Historical charts on platforms like TradingView allow traders to replay past setups and assess performance. Many find that the pattern works best in markets with strong trending behavior followed by sharp reversals. It’s less effective in range-bound environments where volatility doesn’t escalate meaningfully. Ultimately, personal validation through testing builds confidence and helps traders refine their edge.
Conclusion: Leveraging the Falling Megaphone Pattern in Your Trading Arsenal
The falling megaphone pattern is more than a chart shape—it’s a window into market psychology. Its expanding structure reveals the breakdown of a downtrend and the emergence of bullish pressure. When identified correctly and confirmed with volume, momentum, and multi-timeframe alignment, it offers a high-probability opportunity to enter early in a new uptrend.
Success doesn’t come from recognizing the pattern alone, but from executing a disciplined strategy. From entry and stop placement to profit targets and risk control, every element matters. While no pattern guarantees profits, the falling megaphone—when traded with precision—can become a powerful tool in any trader’s toolkit. Mastery comes through study, practice, and experience. By integrating this pattern into your analysis and testing it across real-world scenarios, you gain not just a signal, but a deeper understanding of how markets evolve—and how to anticipate their next move.
1. Is a falling broadening wedge considered a bullish or bearish chart pattern?
A falling broadening wedge, also known as a falling megaphone pattern, is considered a bullish reversal chart pattern. It typically forms after a downtrend and signals a potential shift in momentum from bearish to bullish.
2. How does the falling megaphone pattern differ from a traditional falling wedge pattern?
The key difference lies in their trendlines:
- A falling megaphone pattern has two trendlines that diverge (spread apart) as they slope downwards, indicating increasing volatility.
- A falling wedge pattern has two trendlines that converge (come together) as they slope downwards, indicating decreasing volatility and consolidation.
Both are generally bullish reversal patterns, but the underlying market psychology they represent is different.
3. What are the critical steps to accurately identify a falling megaphone pattern on a price chart?
To accurately identify a falling megaphone pattern:
- Downtrend Context: The pattern should ideally form after a clear downtrend.
- Diverging Trendlines: Draw an upper resistance line connecting at least two lower highs and a lower support line connecting at least two lower lows. These lines must diverge (spread apart) as they move downwards.
- Price Swings: Observe price action that makes sequential lower lows and lower highs within the expanding range.
- Volume Analysis: Look for declining volume during the pattern’s formation, followed by a surge in volume on the eventual upward breakout.
4. Can the falling megaphone pattern be used for both swing trading and day trading strategies?
Yes, the falling megaphone pattern can be applied to both swing trading and day trading strategies. However, its reliability often increases on higher timeframes (e.g., daily, weekly charts) for swing trading, as these patterns tend to be more significant and less prone to false signals. For day trading, it can be used on intraday charts (e.g., 15-minute, 1-hour) but usually requires quicker execution and tighter risk management due to increased market noise.
5. What is the significance of volume during the formation and breakout of a falling megaphone pattern?
Volume is a crucial confirming factor:
- During the formation, volume typically declines, signaling investor indecision and weakening selling pressure.
- On the upward breakout above the upper trendline, a significant surge in volume is expected. This confirms strong buyer interest and validates the bullish reversal, adding conviction to the pattern’s signal.
6. How reliable is the falling megaphone pattern as a predictor of future price movements?
The falling megaphone pattern is generally considered a moderately reliable bullish reversal pattern. Its reliability significantly increases when confirmed by other technical indicators, strong volume on breakout, and proper risk management. No chart pattern is 100% accurate, and false signals can occur, making diligent analysis and risk control essential.
7. Are there any specific indicators or confirmations that should be used with the falling megaphone pattern?
Yes, combining the falling megaphone pattern with other indicators can enhance its reliability:
- Volume: As mentioned, crucial for breakout confirmation.
- Momentum Oscillators (RSI, Stochastic): Look for bullish divergence (price makes lower lows, oscillator makes higher lows) at the pattern’s bottom.
- Candlestick Patterns: Bullish candlestick patterns (e.g., hammer, bullish engulfing) at the breakout point or during a retest can provide further confirmation.
- Multi-Timeframe Analysis: Confirming the pattern’s validity on higher timeframes can add conviction.
8. What are the typical target prices and stop-loss placements when trading this pattern?
Target Prices:
- Measure the vertical distance of the widest part of the megaphone and project it from the breakout point.
- Identify previous significant resistance levels.
- Use Fibonacci extension levels from the prior downtrend or internal swings.
Stop-Loss Placements:
- Just below the low of the breakout candle.
- Below the most recent significant swing low within the pattern.
- Slightly below the retested trendline after a conservative entry.
9. Does the rising megaphone pattern have inverse implications compared to the falling megaphone?
Yes, a rising megaphone pattern (also known as an ascending broadening formation or broadening top) generally has inverse, bearish implications compared to the falling megaphone. It typically forms after an uptrend with upward-sloping, diverging trendlines and signals a potential bearish reversal, indicating a market top and a likely downtrend to follow.
10. Where can I find examples or case studies of the falling megaphone pattern in real markets?
You can find examples and case studies of the falling megaphone pattern by:
- Reviewing historical charts on platforms like TradingView, MetaTrader, or other charting software.
- Searching financial education websites and technical analysis blogs (e.g., StockCharts.com, Investopedia) which often publish articles and analyses featuring specific chart patterns.
- Consulting technical analysis books, such as those by John J. Murphy or Thomas Bulkowski, which frequently include annotated examples.
留言