Mastering Trends with the Double Parabolic SAR Strategy
Welcome, future trend masters! In the dynamic world of financial markets, identifying and riding trends is often the key to sustained profitability. Many tools exist to help us in this quest, and among the most compelling is the Parabolic SAR, or PSAR. Developed by the legendary J. Welles Wilder Jr., the PSAR is a unique indicator known for its ability to highlight potential trend reversals and serve as a dynamic trailing stop.
However, like any single tool, the standard PSAR has its limitations. You might have noticed that it can generate numerous false signals in markets that are choppy or trading sideways. This noise can erode your capital and confidence. So, how can we enhance this powerful indicator to filter out the static and focus on higher-probability opportunities? The answer lies in the Double Parabolic SAR strategy.
In this comprehensive guide, we will delve deep into the mechanics of the PSAR, understand why a single instance might fall short, and then explore the elegant solution offered by the Double Parabolic SAR. We will dissect its implementation, discuss its advantages and limitations, and equip you with the knowledge to apply it effectively in your own trading.
Are you ready to elevate your trend-following game? Let’s begin this journey together.
The Foundation: Understanding the Single Parabolic SAR
Before we add a second layer, it’s crucial to have a crystal-clear understanding of the fundamental Parabolic SAR. The acronym SAR stands for “Stop and Reverse,” which hints at its primary function: indicating where you should potentially place your stop-loss order and when the trend might be reversing, signaling a potential exit or entry in the opposite direction.
Visually, the PSAR appears as a series of dots plotted on your price chart. When the market is in an uptrend, these dots appear *below* the price bars. As the uptrend continues, the dots follow the price upwards, acting like a climbing escalator for your trailing stop. Conversely, when the market is in a downtrend, the dots appear *above* the price bars and follow the price downwards.
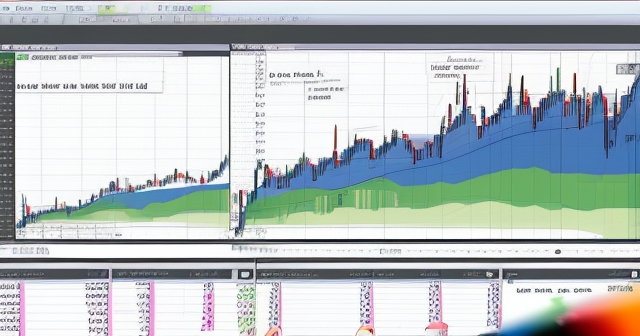
The critical signal from the standard PSAR occurs when the price bar *crosses* the PSAR dot. This crossover suggests a potential shift in momentum and signals a possible trend reversal. If the price crosses above the dots previously below it, it might indicate the start or continuation of an uptrend. If the price crosses below the dots previously above it, it might signal the beginning or continuation of a downtrend.
Wilder designed the PSAR to keep you on the right side of a trending market. The idea is simple: stay in the trade as long as the price remains above the PSAR dots (for long trades) or below them (for short trades). Exit (or reverse) when the price touches or crosses the dots. This makes it an inherently trend-following and reversal-spotting tool.
Deconstructing the Parabolic SAR Formula & Parameters
While you don’t necessarily need to calculate the PSAR manually on your trading platform, understanding its underlying mechanics provides valuable insight into its behavior. The calculation is iterative, meaning each day’s (or period’s) SAR value depends on the previous day’s value and price action. The core formula revolves around the concept of an Acceleration Factor (AF) and the Extreme Point (EP).
For an uptrend:
SAR_new = SAR_current + AF * (EP_current - SAR_current)
For a downtrend:
SAR_new = SAR_current - AF * (SAR_current - EP_current)
Let’s break down the components:
- EP (Extreme Point): This is the highest high reached during the current uptrend or the lowest low reached during the current downtrend. It’s the ‘extreme’ price point driving the trend.
- AF (Acceleration Factor): This is a variable that starts at an initial value (often 0.02) and increases by a step increment (also often 0.02) each time a new EP is recorded. This causes the SAR dots to accelerate and catch up to the price more quickly as the trend matures.
- Maximum Acceleration (MA): The AF has a cap, the Maximum Acceleration (often set at 0.20). The AF will never exceed this value, preventing the SAR from becoming too sensitive and generating premature signals in strong trends.
| Parameter | Description |
|---|---|
| EP (Extreme Point) | Highest high in uptrend or lowest low in downtrend. |
| AF (Acceleration Factor) | Variable that increases with each new EP. |
| MA (Maximum Acceleration) | Cap on AF preventing excess sensitivity. |
The standard settings are typically AF step = 0.02 and Maximum AF = 0.20. However, these parameters are crucial for customization. A smaller AF (e.g., 0.01) makes the SAR slower and less sensitive, resulting in wider trailing stops but potentially catching larger moves. A larger AF (e.g., 0.03) makes the SAR faster and more sensitive, resulting in tighter stops and quicker reversals, suitable for shorter-term trading or less volatile markets.
Understanding how the AF accelerates explains why the PSAR gets closer to the price over time in a sustained trend. This built-in mechanism is designed to tighten the trailing stop as profits accumulate, protecting those gains more aggressively as the trend matures.
Practical Application of Single PSAR: Trailing Stops and Reversal Signals
So, how do traders typically use the single Parabolic SAR in practice? The most common applications are as a dynamic trailing stop-loss and as a potential trend reversal signal generator.
As a Trailing Stop: Once you are in a trade (long or short), the PSAR dot provides a clear level where you should place your stop-loss order. As the price moves favorably, the PSAR dot also moves, automatically tightening your stop. This is its most powerful feature – it prevents you from giving back significant profits if the trend suddenly reverses. You simply move your physical stop-loss order to the level indicated by the latest PSAR dot for the current period. This takes some of the emotional guesswork out of managing trades.
As a Reversal Signal: A classic PSAR trading rule is to enter a trade when the price crosses the SAR dots. If the price crosses above the dots, you might consider entering a long position. If the price crosses below the dots, you might consider entering a short position. The previous trend is assumed to be reversing when this crossover occurs.
For example, imagine you’re watching a stock in a clear downtrend, with the PSAR dots marching above the price. Suddenly, a strong bullish candle pushes the price above the latest PSAR dot. This crossover could be interpreted as a signal to exit your short position or even enter a new long position, anticipating a potential uptrend.
However, relying solely on the PSAR crossover for entry signals can be problematic, particularly in certain market conditions. This leads us directly to the main challenge with the single PSAR.
The Problem: Why Single PSAR Fails in Choppy Markets
While the Parabolic SAR excels in strong, sustained trends, its performance deteriorates significantly in markets that are trading sideways, ranging, or experiencing low volatility. This is its Achilles’ heel.
In a choppy market, prices are not moving in a clear direction but rather oscillating within a range. The price bars frequently cross back and forth over the PSAR dots, leading to what are known as “whipsaws” or “false signals.” The indicator flips rapidly between signaling an uptrend (dots below) and a downtrend (dots above), causing traders to enter and exit positions repeatedly, often incurring small losses with each false signal.
Think of it like trying to use a high-speed train on a winding local track. The train is built for straight lines and speed, but the track is full of turns and stops, making it inefficient and frustrating. Similarly, the PSAR is built for smooth trends, and choppy markets are the “winding track” where it struggles.
These false signals are not just annoying; they are costly. Each whipsaw results in transaction costs (spreads, commissions) and emotional drain. A series of small losses can quickly accumulate and erode your trading capital and confidence. This vulnerability in non-trending markets is the primary motivation behind developing strategies that enhance the basic PSAR, such as the Double Parabolic SAR.
We need a way to filter out these low-probability signals generated during sideways price action and focus only on those signals that align with a more significant directional move. This is where the “double” aspect comes into play.
Introducing the Double Parabolic SAR Concept: The Multi-Timeframe Approach
The most prevalent and powerful interpretation of the “Double Parabolic SAR strategy” involves utilizing the PSAR indicator on *two different timeframes* simultaneously. This is a classic multi-timeframe analysis technique applied specifically to the PSAR.
The core idea is elegantly simple: use a longer timeframe (e.g., Daily chart) to identify the dominant, overarching trend direction, and use a shorter timeframe (e.g., 4-hour or 1-hour chart) to pinpoint precise entry and exit points *only* in the direction confirmed by the longer timeframe.
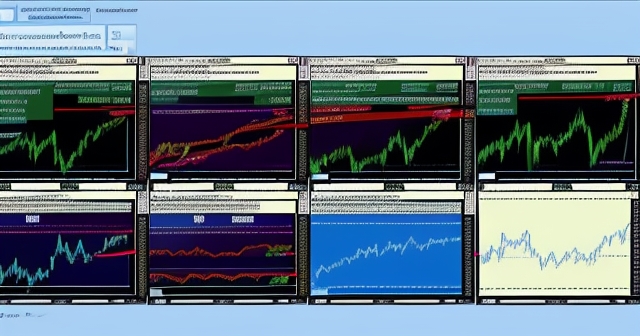
Imagine you are planning a road trip. The longer timeframe is like checking the overall highway system and direction of your destination (Are you going North, South, East, or West?). The shorter timeframe is like looking at the specific turns and traffic lights on your chosen route (When exactly should you turn? When is it safe to proceed?). You wouldn’t ignore the highway map and just focus on local turns, would you?
Here’s how it typically works:
- Longer Timeframe PSAR: You add the PSAR to a longer chart (e.g., Daily). You only consider taking trades that align with the trend indicated by *this* PSAR. If the dots are below the price (uptrend), you *only* look for long opportunities on your shorter timeframe. If the dots are above the price (downtrend), you *only* look for short opportunities on your shorter timeframe. If the dots are flipping back and forth rapidly on the longer timeframe, it signals a lack of clear trend, and you might avoid trading this asset altogether.
- Shorter Timeframe PSAR: You add the PSAR (often with the same or slightly adjusted parameters) to your preferred trading timeframe (e.g., 4-hour). This is where you look for your specific entry and exit signals. However, you *only* act on signals that are in harmony with the trend direction identified on the longer timeframe.
| Step | Process |
|---|---|
| 1 | Add PSAR to longer timeframe (Daily) for trend direction. |
| 2 | Only take long/short trades based on longer timeframe signals. |
| 3 | Add PSAR to shorter timeframe (4-hour) for entry/exit signals. |
This multi-timeframe filter is incredibly effective at reducing false signals because it prevents you from entering trades that contradict the main market momentum. A whipsaw on the 15-minute chart is far less concerning if the Hourly or 4-hour chart is showing a strong, confirmed trend in the opposite direction.
Typical timeframe combinations include Daily/4-hour, 4-hour/1-hour, 1-hour/15-minute, or even 15-minute/5-minute for more aggressive traders. The choice depends on your trading style and preferred holding period.
If you’re venturing into the world of Forex trading, where multi-timeframe analysis is particularly popular due to constant market movement, having access to robust platforms that support these analytical techniques is key. Platforms that offer multiple chart windows and smooth timeframe switching can greatly enhance your workflow. If you’re considering starting or expanding your Forex trading journey, Moneta Markets, an Australian-based platform offering over 1000 instruments, could be a suitable option.
Building Your Multi-Timeframe Strategy: Entry & Exit Rules
Now that we understand the core concept of the multi-timeframe Double PSAR, let’s define concrete rules for trade entry and exit. Remember, the exact rules can be tweaked based on your testing and preferences, but here’s a common framework:
Long Entry Signal:
For a long trade using the multi-timeframe Double PSAR:
- Check the Longer Timeframe (e.g., Daily): Confirm that the PSAR dots are currently BELOW the price, indicating an established uptrend. If not, disregard potential long signals on the shorter timeframe.
- Check the Shorter Timeframe (e.g., 4-hour): Wait for a signal that aligns with the longer-term uptrend. The most common entry signal is when the price on the shorter timeframe crosses *above* the shorter timeframe’s PSAR dots.
- Execute: Once both conditions are met (longer TF uptrend, shorter TF bullish crossover), you enter a long position at the open of the next candle or when the price confirms the crossover.
Short Entry Signal:
For a short trade:
- Check the Longer Timeframe (e.g., Daily): Confirm that the PSAR dots are currently ABOVE the price, indicating an established downtrend. If not, disregard potential short signals on the shorter timeframe.
- Check the Shorter Timeframe (e.g., 4-hour): Wait for a signal that aligns with the longer-term downtrend. The most common entry signal is when the price on the shorter timeframe crosses *below* the shorter timeframe’s PSAR dots.
- Execute: Once both conditions are met (longer TF downtrend, shorter TF bearish crossover), you enter a short position.

Exit Strategy (incorporating the PSAR’s strength):
The PSAR’s built-in trailing stop is perfect for managing open positions:
- Stay in the trade as long as the price remains on the correct side of the PSAR dots on your *trading* timeframe (the shorter one).
- Exit the trade when the price on the shorter timeframe crosses *through* the PSAR dots. This acts as your dynamic trailing stop-loss and potential profit take. You can place your initial stop-loss just on the other side of the first PSAR dot after your entry candle and move it as the dots advance.
- Alternatively, you can use the longer timeframe PSAR as a more distant, slower stop, while managing closer exits with the shorter timeframe PSAR or other criteria.
Combining the multi-timeframe analysis for entry filtering with the PSAR’s dynamic stop for exit management creates a robust trend-following system designed to ride profitable trends while protecting your capital.
Beyond Two Timeframes: Alternative Double PSAR & Indicator Combinations
While the multi-timeframe approach is the most popular “Double” PSAR strategy, the concept can be interpreted in other ways, and the PSAR (single or double) can be combined with other technical indicators for added confirmation.
Two PSARs on the Same Timeframe: Another variation involves plotting *two* Parabolic SAR indicators on the *same* chart timeframe, but with different parameter settings. For example, you might use a “faster” PSAR (smaller AF step, lower MA) and a “slower” PSAR (larger AF step, higher MA, or just different step/max values). A potential trading rule could be to enter a long trade only when *both* PSARs show dots below the price, or even specifically when the faster PSAR crosses below price *after* the slower PSAR is already below price.
This approach attempts to replicate the filtering effect of multiple timeframes on a single chart. The slower PSAR acts as the trend filter (like the longer timeframe), and the faster PSAR provides the entry trigger (like the shorter timeframe). However, interpreting two sets of dots on one chart can sometimes be visually complex.
Combining PSAR with Other Indicators: The PSAR can also be integrated into a broader strategy alongside other complementary technical indicators. Since the PSAR is a lagging, trend-following indicator, combining it with indicators that offer different perspectives can improve signal quality.
- Moving Averages (e.g., EMAs): You could require price to be above a long-term EMA (like the 200 EMA) to confirm an uptrend before taking a long PSAR signal. Or you could use an EMA crossover as the primary trend filter and the PSAR signal for precise entry. For instance, only look for long PSAR signals when the 50 EMA is above the 200 EMA.
- Oscillators (e.g., RSI, MACD): These indicators can help gauge momentum or identify potential divergence. For example, you might only take a bullish PSAR signal if the RSI is above 50 or if the MACD has just crossed above its signal line. This adds a momentum filter to the trend signal.
- Volume: For stock trading especially, confirming a PSAR signal with increasing volume can add conviction, suggesting strong participation in the move.
The key to combining indicators is ensuring they complement each other and don’t simply provide redundant information. The goal is to build a confluence of evidence supporting your trade decision, thereby increasing the probability of success. The Double PSAR strategy, in its multi-timeframe form, often pairs well with simple trend-confirming tools like moving averages on the longer timeframe.
Advantages and Real-World Benefits of the Double PSAR
By implementing the Double Parabolic SAR strategy, particularly using the multi-timeframe approach, you gain several significant advantages over relying on a single PSAR instance:
- Enhanced Signal Quality: The primary benefit is the reduction of false signals. By requiring alignment across different timeframes, you filter out the noise generated by shorter-term price fluctuations and focus on trades that are in line with the dominant market direction. This means fewer whipsaws and potentially more reliable entry signals.
- Improved Trend Capture: The strategy is designed to identify and stick with established trends. The longer timeframe confirms the presence of a trend, and the shorter timeframe helps you enter relatively early in that trend’s development or during opportune pullbacks within the trend.
- Dynamic Risk Management: The PSAR’s built-in trailing stop mechanism is retained and utilized on your trading timeframe. This provides a clear, objective method for managing your stop-loss and protecting accumulated profits as the trade moves in your favor. This automates a crucial aspect of trade management.
- Versatility: The underlying PSAR indicator and the multi-timeframe analysis technique are applicable across various financial instruments, including Forex pairs, stocks, indices, and commodities. You can adapt the timeframes and parameters to suit the specific characteristics of the asset you are trading.
- Clear Rules: While requiring interpretation, the signals (crossovers on specific timeframes) are generally objective and easy to identify on a chart, making it suitable for systematic trading and potentially even automation.
In essence, the Double Parabolic SAR strategy leverages the core strength of the PSAR – dynamic stops and trend identification – while mitigating its main weakness by adding a layer of trend filtering. This makes it a more robust and potentially more profitable approach for trend followers compared to the basic single PSAR.
Navigating the Risks: Limitations and How to Mitigate Them
No trading strategy is foolproof, and the Double Parabolic SAR is certainly not without its limitations. Understanding these risks is crucial for applying the strategy responsibly and effectively.
The most significant limitation, inherited from the single PSAR, is its poor performance in choppy, ranging, or sideways markets. While the multi-timeframe filter helps reduce false signals compared to a single PSAR, it doesn’t eliminate them entirely. If both timeframes become choppy, the strategy will still likely generate whipsaws. Mitigation: Actively identify market conditions. Avoid using this strategy when price is clearly consolidating or moving within a narrow range on both your longer and shorter timeframes. Consider using complementary indicators (like ADX) to confirm trend strength, and only trade when trend strength is high.
The PSAR is a lagging indicator. It reacts to price movement that has already occurred. In extremely fast or volatile reversals, the PSAR might flip *after* a significant portion of the move has already happened, potentially leading to suboptimal exit points or late entry signals. Mitigation: Be aware that you might not catch the absolute peak or trough of a move. Accept that some slippage is possible in volatile conditions. Consider combining with leading indicators or using other exit criteria (e.g., fixed profit targets) in conjunction with the PSAR stop.
The strategy relies purely on technical analysis. It does not take into account fundamental news events, economic releases, or overall market sentiment, which can be powerful drivers of price movement. A strong fundamental surprise can override technical signals. Mitigation: Be aware of major economic news releases scheduled during your trading hours. Consider pausing trading or tightening stops around significant news events that could introduce unpredictable volatility.
Parameter sensitivity is another point to consider. The performance of the strategy is highly dependent on the PSAR parameters (AF, MA) and the chosen timeframe combination. Suboptimal parameters for a specific asset or market condition can lead to poor results. Mitigation: Rigorously backtest the strategy with different parameters and timeframe combinations on the specific instrument you intend to trade. Don’t assume settings that work for one Forex pair will work for another, or for a stock index.
Finally, over-optimization is a risk during the testing phase. You might find parameters that worked perfectly on historical data but fail in live trading because they are curve-fitted to past noise rather than robustly capturing underlying market behavior. Mitigation: Test your chosen parameters across different historical periods, including varied market conditions (trending, ranging, volatile). Use out-of-sample testing (testing on data the strategy hasn’t seen before). Be cautious of parameters that seem too good to be true or that change drastically with slight data variations.
Optimizing Your Double PSAR Strategy: Parameter Tuning & Backtesting
Implementing the Double Parabolic SAR strategy effectively is not just about understanding the rules; it’s fundamentally about optimizing its parameters and validating its performance through rigorous backtesting. This step is non-negotiable for building a truly EEAT-compliant trading approach – demonstrating experience, expertise, and trust through data-driven validation.
Parameter Tuning: The standard PSAR settings (0.02, 0.20) are just starting points. For the Double PSAR, you need to consider the parameters for the PSAR(s) used on *both* timeframes (if using multi-timeframe) or for *each* PSAR (if using two on one timeframe). Key parameters to test and tune include:
- Initial Acceleration Factor (Step): How quickly the PSAR starts to catch up.
- Acceleration Increment: By how much the AF increases with each new EP.
- Maximum Acceleration: The cap on the AF, determining the maximum proximity of the SAR to price.
Smaller values for step and increment make the PSAR slower and less sensitive, suitable for capturing longer trends but potentially with larger drawdowns during reversals. Larger values make it faster and more sensitive, good for quicker trades or tighter stops in lower volatility, but prone to whipsaws in choppy conditions. You need to find a balance that fits your trading style and the specific instrument’s volatility characteristics.
Timeframe Selection: The combination of timeframes is itself a crucial parameter. Experiment with different pairings (e.g., Daily/4-hour, 4-hour/1-hour, 1-hour/15-minute). The longer timeframe should be sufficient to show clear trends, while the shorter timeframe should offer enough signals for your desired trading frequency without being excessively noisy. A common rule of thumb is a ratio of 4:1 or 6:1 between the longer and shorter timeframes.
| Optimization Aspect | Description |
|---|---|
| Parameter Setting | Refining initial AF, increment, and max values. |
| Timeframe Pairing | Selecting suitable longer and shorter timeframes. |
| Backtesting | Testing rules against historical price data. |
Backtesting: Once you have potential parameters and timeframe combinations, you must backtest the strategy on historical data. This involves applying your exact entry and exit rules to past price data and recording the results. What was the profit factor? The win rate? The average win vs. average loss? The maximum drawdown? How did it perform in trending periods vs. ranging periods?
Most modern trading platforms offer built-in backtesting capabilities. You can often code the specific rules of your Double PSAR strategy (or find pre-coded indicators/strategies) and run simulations over years of data. This is where you gather the empirical evidence to support whether your chosen parameters and rules are historically effective for that specific asset.
Remember to test on a significant amount of data covering various market cycles. Don’t just test on a period where the market was strongly trending if you expect to trade through different conditions. Robust backtesting results give you confidence in the strategy’s potential edge.
If you’re looking for trading platforms that facilitate robust backtesting and provide access to a wide range of instruments for optimization, especially within the Forex and CFD markets, you might find that Moneta Markets is a platform worth considering. It supports popular platforms like MT4 and MT5, known for their backtesting engines, and offers a variety of assets to test your Double PSAR strategy on.
Bringing It All Together: Tips for Successful Double PSAR Trading
Mastering the Double Parabolic SAR strategy, like any advanced trading technique, requires more than just knowing the rules. It demands discipline, continuous learning, and adaptation. Here are some tips to help you succeed:
- Start with the Fundamentals: Ensure you truly understand the single PSAR before moving to the double version. Practice identifying PSAR signals on charts in different market conditions.
- Choose Your Timeframes Wisely: Select timeframes that match your trading style and availability. Don’t try to scalp the 1-minute chart if you only have time to check your trades a few times a day.
- Prioritize the Longer Timeframe: Always respect the signal from your longer timeframe. It’s your primary filter. If the longer timeframe isn’t clearly trending, be extremely cautious or simply stand aside.
- Be Patient: The multi-timeframe approach will generate fewer signals than a single PSAR on a short timeframe. This is a feature, not a bug. Wait for high-probability setups where both timeframes align.
- Implement Strict Risk Management: Always use stop-losses. The PSAR provides a natural place for a trailing stop, but also consider placing an initial hard stop based on volatility or chart structure. Never risk more than a small percentage (e.g., 1-2%) of your capital on any single trade.
- Understand Market Context: Supplement your technical analysis by being generally aware of major economic events or news that could impact the assets you trade. Technical indicators are powerful, but they operate within a larger market context.
- Test and Optimize Continuously: Market dynamics change. Parameters that worked perfectly last year might need adjustment this year. Regularly review your strategy’s performance and consider re-optimizing parameters on recent data (while avoiding over-optimization).
- Journal Your Trades: Keep a detailed trading journal. Record every trade, the entry/exit signals, your reasoning, and the outcome. Analyze your wins and losses to identify patterns and areas for improvement in your application of the Double PSAR.
- Start Small or Demo Trade: Before risking significant capital, practice the strategy on a demo account or with very small position sizes. Build confidence and refine your execution.
- Manage Your Psychology: Don’t let false signals or losses derail your discipline. Trading involves losing trades. Stick to your plan, manage your risk, and focus on the long-term probability edge the strategy might offer after optimization.
The Double Parabolic SAR strategy offers a refined and more robust approach to trend following than its single counterpart. By combining the indicator with multi-timeframe analysis or thoughtful parameter variations, you create a powerful filter to identify higher-probability trading opportunities and effectively manage risk dynamically.
Remember, profitability in trading comes from understanding your tools deeply, having a well-defined strategy validated by testing, practicing disciplined execution, and managing your own psychology. Embrace the learning process, put in the work, and you can leverage strategies like the Double Parabolic SAR to navigate the markets with greater confidence and potentially achieve your trading goals.
double parabolic sar strategyFAQ
Q:What is the purpose of using a Double Parabolic SAR strategy?
A:The Double Parabolic SAR strategy enhances trend detection by applying the PSAR indicator across two different timeframes, filtering out false signals and identifying higher-probability trade opportunities.
Q:How do I select the timeframes for the Double Parabolic SAR strategy?
A:Choose a longer timeframe (e.g., Daily) to identify the overall trend and a shorter timeframe (e.g., 4-hour) for precise entry and exit points that align with the longer trend.
Q:What are some limitations of the Double Parabolic SAR strategy?
A:It can still generate false signals in choppy or sideways markets, and performance is sensitive to selected parameters and timeframes.
留言