
“`html
Unpacking the Doji: Decoding Market Indecision with Candlestick Patterns
Welcome to our exploration of the Doji candlestick pattern, a seemingly simple yet profoundly insightful signal in the world of technical analysis. As traders, we constantly seek to understand the pulse of the market, to discern the subtle shifts in supply and demand that precede price movements. Candlestick charting, with its rich history tracing back to Japanese rice traders centuries ago, provides us with a powerful visual language to do just that. And among the pantheon of candlestick patterns, the Doji holds a unique place, often appearing as a solitary cross or plus sign, whispering tales of market balance, hesitation, and potential turning points. But what does this silent signal truly tell us? Is it a guaranteed indicator of reversal, or something more nuanced? Together, we will peel back the layers of the Doji, understanding its formation, its various forms, and how we can effectively integrate it into our trading strategies to gain a clearer perspective on market sentiment.
In the dynamic landscape of financial markets, from bustling stock exchanges to the rapidly evolving crypto space and the intricate world of options trading, grasping the language of candlesticks is fundamental. The Doji, in particular, serves as a critical alert—a pause in the relentless tug-of-war between buyers and sellers. Learning to read the Doji is like gaining access to a snapshot of human nature at a specific price point and time, showing us where conviction wavered and where a potential shift in momentum might be brewing. Let’s dive in and uncover the secrets held within this fascinating pattern.
Key points about the Doji include:
- The Doji signifies a moment of market indecision, with open and close prices being nearly identical.
- This pattern can appear at critical junctions in price trends, indicating potential reversals or continuations.
- Successful trading involves integrating Doji signals with other indicators for greater reliability.
What Exactly is a Doji Candlestick?
At its core, a Doji candlestick is a visual representation of market indecision. It forms during a trading session when the security’s open price and close price are virtually identical or extremely close. Unlike most candlesticks which have a distinct body representing the difference between the open and close, a Doji has a very small or practically nonexistent body. Its appearance is typically that of a cross, an inverted cross, or a plus sign.
Think of it this way: during the trading period represented by the candle (it could be a minute, an hour, a day, or a week), both buyers (bulls) and sellers (bears) were actively pushing the price around. The price might have rallied significantly (creating an upper shadow) and plunged dramatically (creating a lower shadow), showcasing volatility and fierce battling. However, by the time the session ended, neither side could maintain control, and the price settled back right around where it started. This standoff is precisely what the Doji pattern encapsulates – a moment of equilibrium where buying and selling pressure were perfectly balanced, at least momentarily.
The presence of shadows (or wicks) extending above and below the tiny body is common and important. The upper shadow shows the highest price reached during the period, and the lower shadow indicates the lowest price. The length of these shadows, combined with the position of the small body (or line), gives rise to different variations of the Doji, each potentially carrying slightly different implications about the nature of the indecision or the battle fought within that session. While the core signal is indecision, the extremes reached during the fight (represented by the shadows) provide additional context.
Understanding the Doji starts with recognizing this fundamental shape: a line representing the open and close, with potential lines (shadows) extending up and down from it. It’s a simple pattern, but its power lies not just in its shape, but in where it appears on the chart.

The Language of Dojis: Types and Their Meanings
While the basic Doji signals indecision, variations in its structure—specifically the length and position of its shadows—can provide more specific insights into the market’s mood and the nature of the battle between buyers and sellers. Let’s explore the main types of Doji patterns you will encounter in your technical analysis journey.
The most fundamental is the Standard Doji. This pattern has a very small or absent body with short upper and lower shadows of roughly equal length. It simply indicates that indecision prevailed throughout the session, with neither bulls nor bears managing to gain significant ground or push the price far from the opening/closing level. It’s a moment of pause, perhaps before a move, but inherently neutral on its own.
Next, we have the Long-legged Doji. This is perhaps the most dramatic representation of indecision and volatility. It features a very small body (or a line) with very long upper and lower shadows. This indicates that during the trading session, prices whipsawed wildly up and down, potentially reaching significant highs and lows, before ultimately closing near the open. The long shadows signify extreme volatility and a fierce battle, but the close near the open shows that despite the wide price swings, neither side could secure a definitive victory by the end of the period. This pattern suggests heightened market tension and often precedes a significant move as the market resolves the indecision.
The Gravestone Doji is a potentially bearish reversal pattern, frequently observed at the top of an uptrend. It forms when the open and close prices are near the *low* of the trading session, creating a long upper shadow and little to no lower shadow or body. Imagine this: the session opened, bulls tried hard to push prices higher (creating the upper shadow), but they were ultimately rejected, and sellers drove the price back down to close near the opening low. This demonstrates that while buyers were present, sellers ultimately won the battle by the end of the session, signaling potential bearish pressure. A Gravestone Doji at a resistance level or after a strong rally should certainly grab your attention.
Conversely, the Dragonfly Doji is a potentially bullish reversal pattern, often seen at the bottom of a downtrend. It forms when the open and close prices are near the *high* of the trading session, creating a long lower shadow and little to no upper shadow or body. Picture this scenario: the session opened, sellers tried to push prices lower (creating the long lower shadow), but buyers stepped in forcefully, pushing the price back up to close near the opening high. This shows that despite bearish attempts, buyers ultimately controlled the session’s close, suggesting potential bullish pressure. A Dragonfly Doji appearing at a support level or after a significant decline is a signal that bulls might be stepping in.
| Type of Doji | Characteristics | Market Implication |
|---|---|---|
| Standard Doji | Very small or absent body | Indecision |
| Long-legged Doji | Small body, long upper/lower shadows | High volatility |
| Gravestone Doji | Long upper shadow, small body at low | Potential bearish reversal |
| Dragonfly Doji | Long lower shadow, small body at high | Potential bullish reversal |
Finally, the Doji Star is not a standalone Doji but refers to a Doji pattern that forms after a large, strong directional candle (either bullish or bearish), and typically gaps away from the previous candle’s body. The Doji Star suggests that the strong momentum from the previous session has suddenly stalled, and indecision has set in. This pattern often precedes more complex candlestick reversal patterns like the Morning Star or Evening Star, highlighting the Doji’s role as an initial warning signal.
Each of these Doji variations, through the visual story told by their shadows and tiny bodies, provides clues about the specific nature of the market’s indecision and the potential next steps. Recognizing these distinct forms is the first step in harnessing their power.
Interpreting the Signal: Reversal, Continuation, or Pause?
While the Doji is widely taught as a potential signal for a trend reversal, this is only one aspect of its interpretation. A critical concept to understand is that the Doji pattern, in isolation, is fundamentally a neutral indicator. Its true meaning and potential significance are derived almost entirely from its context within the prevailing price trend and surrounding price action.
If a Doji appears after a prolonged, strong uptrend, especially near a significant resistance level, it increases the probability that it could be signaling a potential bearish reversal. It suggests that the buying pressure which drove the price up is finally meeting strong selling resistance, leading to a stalemate. Similarly, a Doji forming after a significant downtrend, particularly near a support level, might indicate that selling pressure is waning and buyers are beginning to step in, hinting at a potential bullish reversal.
However, a Doji appearing during a period of consolidation or sideways trading doesn’t necessarily signal an imminent reversal. In this context, it merely reinforces the existing state of indecision or balance. It could be a sign that the market is taking a breather before continuing in the original direction, or simply chopping within a defined range. A Doji can also appear mid-trend as a brief pause before the trend continues. This is why relying solely on a Doji as a reversal signal without confirmation is inherently risky.
The key takeaway is that the Doji is an alert signal, not a definitive trade signal. It’s the market’s way of saying, “Pay attention! Something might be about to change, or at least the current momentum has paused.” It cues us to look for further clues from subsequent price action or other technical indicators. Has the market indeed changed direction after the Doji? Does volume confirm a potential shift? Are other indicators aligning with a reversal hypothesis?
Consider the psychological aspect: In a strong trend, one side (buyers in an uptrend, sellers in a downtrend) is clearly in control. A Doji represents the moment when the opposing force manages to push back with equal strength, resulting in a draw for the period. This draw doesn’t automatically mean the other side will win the next round, but it undeniably shows a loss of dominance for the previously prevailing force. This shift in the balance of power is what makes the Doji significant, regardless of whether it leads to a reversal or a pause before continuation.
The Doji Rule: A Potential Edge
Beyond simply identifying indecision, there’s a practical principle sometimes referred to as the “Doji Rule” that traders use to anticipate the potential immediate follow-through after a Doji appears. This rule isn’t a universally recognized academic theorem but a trading observation, notably highlighted by figures like Stephen W. Bigalow in candlestick analysis. It suggests that after a Doji forms, the market often tends to move in the direction of the price open of the very next candlestick.
Let’s break this down. If a Doji appears, and the *next* candlestick opens *higher* than the Doji’s high (or slightly above the Doji itself, especially if it gaps up), the “Doji Rule” suggests this indicates a potential bullish move is likely to follow. Conversely, if the next candlestick opens *lower* than the Doji’s low (or gaps down below it), this might signal that a bearish move is probable.
This principle is rooted in the idea of immediate confirmation. After the indecision represented by the Doji, the direction of the very first move of the subsequent period can provide a strong hint about which side (buyers or sellers) has immediately gained control. If the new period opens with aggressive buying (a gap up or open above the Doji high), it suggests the bullish side won the post-Doji battle right at the start. If it opens with aggressive selling (a gap down or open below the Doji low), the bears might have taken the early lead.
For example, if you see a Doji after a downtrend, and the next candle opens strongly higher, the “Doji Rule” points towards a potential bullish follow-through, supporting the idea of a reversal. If you see a Doji after an uptrend, and the next candle opens lower, it leans towards a bearish continuation of the post-Doji direction. This isn’t a standalone strategy, but it offers a potential low-risk entry point based on the immediate market reaction following the period of indecision. You would typically look to enter in the direction of the open of the confirmation candle, with a stop-loss placed strategically below the low of the Doji (for bullish confirmation) or above the high of the Doji (for bearish confirmation). This “rule” emphasizes the critical importance of the candle *following* the Doji.
Beyond the Single Doji: Compound Signals
While a lone Doji provides a potent alert, its power can be amplified when it participates in larger, multi-candlestick patterns or appears in specific formations. These compound signals often provide stronger indications than a single Doji could on its own, as they show how the market resolves the indecision that the Doji represents.
As we briefly touched upon, the Doji Star is a foundational element of more complex patterns. When a Doji forms after a significant bullish candle (gapping away from its body), it’s a Doji Star and the first hint of potential weakness in the uptrend, possibly leading to an Evening Star reversal pattern if followed by a bearish candle. When it forms after a bearish candle (gapping away from its body), it’s a Doji Star signaling potential weakness in the downtrend, possibly leading to a Morning Star reversal if followed by a bullish candle. The Doji here acts as the pivotal point of indecision that sets up the potential reversal.
Another interesting compound signal is sometimes called the “Best Friend” Signal. This occurs when a Doji is immediately followed by a significant price gap in one direction, accompanied by a strong candle in that direction. For instance, a Doji followed by a bullish gap up and a strong bullish candle. This signal suggests that after the period of indecision (the Doji), the market made a very decisive move, leaving no doubt about the immediate direction. The gap signifies strong conviction entering the market right at the open of the new period, acting as powerful confirmation of the direction suggested by the gap. This pattern is less about gradual resolution and more about a sudden, post-indecision surge of directional conviction.
A more complex pattern involving a Doji is the Flutter Kicker Signal. This involves a directional candle (e.g., a strong bullish candle), followed by a Doji, which is then followed by a candle that gaps *against* the direction of the first candle and moves strongly in that opposite direction. For example, a strong bullish candle, followed by a Doji, followed by a gap down and a strong bearish candle. This pattern shows initial momentum, a pause for indecision (the Doji), and then a sudden, strong capitulation and reversal in the opposite direction. It’s a powerful signal of trend exhaustion and sharp reversal.
Finally, seeing a Series of Dojis occurring consecutively on a chart is another potent signal. While a single Doji shows temporary indecision, multiple Dojis in a row indicate prolonged, intense market balance or extreme uncertainty. This often occurs before a very significant price move. The longer the market remains in this state of equilibrium, the greater the potential energy building up for a breakout. When the market finally resolves this extended period of indecision, the resulting move can be quite powerful, as one side decisively overwhelms the other after a prolonged standoff.
These compound patterns illustrate that while the Doji itself signals a pause or indecision, the patterns it forms *with* other candles reveal how that indecision is being resolved, offering deeper insights into potential future price movements and confirming the significance of the initial Doji signal.
Integrating Dojis: Building a Robust Strategy
As we’ve emphasized, relying solely on a Doji candlestick pattern for trading decisions is generally not recommended due to its neutral nature in isolation. The true power of the Doji is unlocked when it’s used in conjunction with other tools and indicators in your technical analysis arsenal. This confluence of signals increases the probability of a successful trade setup and helps filter out false signals.
One of the most common and effective ways to use Dojis is by observing them in relation to key Support and Resistance levels. A Dragonfly Doji forming precisely at a well-established support level is a much stronger bullish signal than a Dragonfly Doji appearing in the middle of a trend channel. Similarly, a Gravestone Doji at a significant resistance level significantly increases the likelihood of a bearish turn. These levels act as magnets for price and often represent areas where supply and demand dynamics are likely to shift, making a Doji at such a level particularly meaningful.
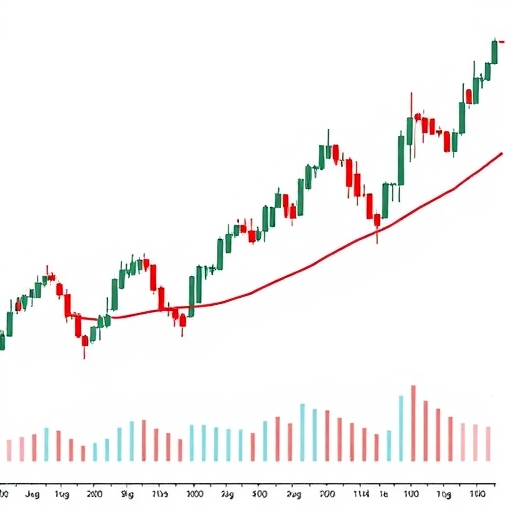
Integrating Dojis with Moving Averages can also be highly effective. For instance, a Doji appearing right at a key moving average like the 200-day Moving Average, or even a shorter-term average like the 8-period Exponential Moving Average (often referred to as the T-line), can add weight to its significance. If a Doji forms after a downtrend and bounces off the 200-day MA, it reinforces the potential for a bullish reversal. A Gravestone Doji forming precisely at the T-line after an uptrend might signal weakness and a potential move back below this key short-term momentum indicator.
Momentum oscillators like the RSI (Relative Strength Index) or MACD (Moving Average Convergence/Divergence) can provide crucial confirmation. If you see a potential bullish Dragonfly Doji reversal signal at support, check if the RSI is showing oversold conditions or if the MACD is showing bullish divergence or a bullish crossover. This confluence strengthens the bullish case. Conversely, a bearish Gravestone Doji at resistance is more compelling if the RSI is overbought or the MACD is showing bearish divergence or a bearish crossover.
Analyzing Volume alongside Dojis is also vital. A Doji appearing on unusually high volume might indicate a more significant battle between buyers and sellers, potentially signifying a more powerful point of indecision and a more volatile resolution to follow. A Doji on low volume might simply represent a period of low activity and less meaningful indecision. For potential reversals, look for increased volume on the candle *following* the Doji, confirming that conviction is entering the market in the new direction.
Finally, utilizing the “Doji Rule” as discussed earlier fits perfectly into integration. After identifying a Doji at a key level or in conjunction with other signals, waiting for the open and initial direction of the *next* candle (the confirmation candle) provides a practical method for timing an entry based on the immediate market reaction to the Doji.
By combining the Doji’s alert signal with the context provided by price levels, trends, moving averages, oscillators, and volume, you move from simply spotting a pattern to building a higher-probability trading setup. This integrated approach respects the Doji’s nature as an alert and leverages other tools to confirm or deny the potential move it suggests.
If you’re exploring different markets, including CFDs, which often track Forex pairs, understanding how to apply these technical analysis principles across various instruments is key. Finding a platform that supports a wide range of assets and provides robust charting tools is essential for this type of analysis. If you’re considering starting Forex trading or exploring more CFD instruments, Moneta Markets is a platform worth considering. It’s based in Australia and offers over 1000 financial instruments, suitable for both beginners and experienced traders.
Real-World Examples and Applications
Let’s look at how Doji patterns manifest in real-world charts and what they can signal across different asset classes. Observing these patterns on live or historical data brings the theoretical concepts to life.
Consider a classic example of a Gravestone Doji in a stock chart, perhaps something like Cyanotech Corp (CYAN) as mentioned in some analyses. If CYAN had been in a strong uptrend, and suddenly, after a period of significant bullish momentum, a Gravestone Doji formed near a previous high or a resistance level, this would be a strong bearish alert. The long upper shadow would show that buyers tried to push the price higher, but sellers aggressively stepped in, rejecting the higher prices and forcing the close back down near the open and low. A trader seeing this would be on high alert for a potential reversal, looking for a subsequent bearish candle or other confirmation before considering a short position or exiting a long one.
In the cryptocurrency market, known for its volatility, Long-legged Dojis are quite common and particularly insightful. If you were watching XRP (Ripple) during a period of consolidation or after a significant move, a Long-legged Doji appearing might signal extreme indecision and potential volatility ahead. The long upper and lower shadows would indicate a violent price swing during that period, but the close back near the open shows neither bulls nor bears could hold their ground. This pattern often precedes a sharp move as the market resolves this intense standoff. For instance, some analysts might point to Long-legged Dojis on XRP charts as potential precursors to significant rallies or drops, emphasizing the need for confirmation from the subsequent price action.
Dojis are also highly relevant in the fast-paced environment of Intraday Options Trading, particularly when looking at Call Option (CE) or Put Option (PE) price charts. If you are trading a CE option and see a potential resistance level being tested, a Gravestone Doji forming on the CE chart at that level could be a strong signal that the option’s price (and likely the underlying asset’s price) is facing resistance, potentially indicating a good time to exit or consider a PE trade. Conversely, a Dragonfly Doji on a PE option chart at a support level might signal potential bullishness for the underlying asset, suggesting the PE option might stop falling or reverse. The quick formation of these patterns on lower timeframes (e.g., 5-minute or 15-minute charts) can provide timely alerts for scalpers or day traders.
Remember, in all these examples, the Doji itself is the alert, but the context (trend, levels) and subsequent action are the confirmation. Whether it’s a stock, crypto, or option, the principle remains the same: the Doji highlights a moment of balance, and we then analyze how that balance is broken.
Limitations and Important Considerations
While the Doji is a valuable tool in the technical analyst’s toolkit, it’s crucial to be aware of its limitations. No single indicator or pattern is foolproof, and the Doji is no exception. Understanding these limitations helps you use the pattern more effectively and avoid potential pitfalls.
Firstly, the Doji pattern is relatively rare. Because it requires the open and close prices to be nearly identical, it doesn’t appear as frequently as many other candlestick patterns or standard chart formations. This rarity means you shouldn’t expect to build a trading strategy solely around spotting Dojis; you need a broader approach.
Secondly, and most importantly, the Doji is a neutral signal in isolation. We’ve stressed this point repeatedly because it’s fundamental. A Doji appearing without context (within a clear trend, at a significant support/resistance level, or confirmed by other indicators) provides very little actionable information. It simply says, “indecision exists.” For it to be meaningful, it requires the confluence of other factors or confirmation from subsequent price action.
Thirdly, while often discussed as a reversal signal, the Doji can just as easily precede trend continuation or consolidation. If the market is pausing mid-trend or consolidating sideways, a Doji simply reflects this pause. The market could resume its original direction after the Doji resolves. Therefore, interpreting every Doji as a potential reversal will lead to many false signals.
Setting precise stop-losses and price targets based *solely* on a Doji can be challenging. The pattern itself doesn’t provide clear price levels for these purposes. While you might place a stop-loss just beyond the high or low of the Doji or the confirmation candle, determining a profit target requires analyzing larger chart patterns, support/resistance levels, or using other technical analysis methods. The Doji tells you where indecision occurred and potentially *which direction* the market might move next (especially with the Doji Rule), but not necessarily *how far* it might go.
Finally, while we often discuss these patterns mathematically or mechanically, remember that they are visual representations of collective human behavior – the fear, greed, hope, and uncertainty of all market participants. The Doji represents a moment where these forces are in perfect balance. Understanding this underlying psychology can sometimes provide a deeper insight than simply memorizing pattern shapes. However, interpreting crowd psychology is inherently complex and not always reliable.
Given these limitations, it’s evident that the Doji serves best as an alert. It flags moments of potential significance, prompting you to investigate further using other technical tools and analysis methods. It’s a piece of the puzzle, not the whole picture.
As you build your trading approach, whether focusing on Forex, stocks, or other CFDs, having a platform that provides robust charting capabilities, access to multiple indicators, and a wide range of markets is crucial for applying integrated technical analysis. When considering brokerage options, Moneta Markets stands out for its flexibility and technical advantages. It supports popular platforms like MT4, MT5, and Pro Trader, combining high-speed execution with competitive low spread settings, offering a solid trading experience. Choosing a platform that supports your analytical needs is an important step in developing your trading edge.
Historical Roots: The Japanese Connection
To truly appreciate the Doji and other candlestick patterns, it’s worth briefly acknowledging their fascinating origin. Candlestick charting is one of the oldest forms of technical analysis, with roots tracing back to 18th-century Japan. The story is often attributed to Munehisa Honma, a legendary rice trader from Sakata, Japan, who is said to have amassed a fortune using sophisticated methods to predict rice prices. Honma’s techniques went beyond simply tracking supply and demand; he also incorporated market psychology and trader sentiment into his analysis, which he charted using methods that would later evolve into modern candlestick patterns.
Honma’s work laid the foundation, observing the relationships between open, high, low, and close prices and assigning meaning to the shapes they formed. The concept of a Doji, representing a stalemate or indecision, aligns perfectly with his focus on the battle between market participants.
These charting techniques remained primarily within Japan for centuries. It wasn’t until the late 1980s that candlestick charting was introduced to the Western world by Steve Nison, a technical analyst who learned the techniques from a Japanese broker. Nison’s seminal book, “Japanese Candlestick Charting Techniques,” popularized the method globally, transforming it from an obscure historical tool into a standard component of technical analysis used by traders worldwide.
Understanding this history reminds us that these patterns are not arbitrary shapes but visualizations developed over centuries to capture the ebb and flow of market sentiment and the fundamental interaction between buyers and sellers. The Doji, in this historical context, is a timeless depiction of a moment when neither side can gain the upper hand, a recurring theme in markets driven by human decision-making.
Conclusion
The Doji candlestick pattern, despite its simple appearance as a cross or plus sign, is a powerful visual representation of market indecision. It occurs when the open and close prices of a security are virtually equal over a given period, signaling a temporary balance between buying and selling pressures. From the Standard Doji representing simple indecision to the Long-legged Doji indicating volatility, the Gravestone Doji hinting at bearish reversals at highs, and the Dragonfly Doji suggesting potential bullish reversals at lows, each variation offers a unique piece of the market puzzle.
However, the core lesson in mastering the Doji is recognizing that it is primarily an alert signal, not a definitive trading command. Its significance is profoundly influenced by its context—where it appears within the prevailing trend, its proximity to key support and resistance levels, and the information provided by companion technical indicators like moving averages, RSI, MACD, and volume. The “Doji Rule,” suggesting potential follow-through in the direction of the subsequent candle’s open, offers a practical way to anticipate the market’s immediate reaction after the indecision.
While Dojis can signal potential reversals, they can also appear during consolidation or before trend continuation, highlighting the crucial need for confirmation. Compound patterns involving Dojis, such as the Doji Star or a Series of Dojis, further illustrate how market indecision can set the stage for significant moves. Understanding the limitations of the Doji—its relative rarity, lack of standalone reliability, and difficulty in using it alone for precise risk management—is just as important as understanding its potential.
Ultimately, incorporating the Doji into your technical analysis means learning to identify moments of market equilibrium and then patiently waiting for confirmation of how that equilibrium is likely to be broken. It’s about combining the timeless insights of Japanese candlestick charting, rooted in human nature and market psychology, with modern technical tools to build a more robust and probabilistic trading strategy. By treating the Doji as a valuable heads-up rather than a standalone instruction, you can leverage its power to better time your entries and exits and navigate the markets with greater confidence and clarity.
doji candlestick patternFAQ
Q:What is a Doji candlestick pattern?
A:A Doji candlestick pattern indicates market indecision, forming when open and close prices are nearly the same.
Q:How do you trade with Doji patterns?
A:Traders often look for confirmation from subsequent candles and use other indicators and levels for context when trading Dojis.
Q:Are Doji patterns always reversal signals?
A:No, Doji patterns can indicate indecision but do not guarantee reversals; context is essential for proper interpretation.
“`
留言