Introduction: Decoding What an Ounce of Gold is Worth Today

Gold has long stood as one of the most enduring symbols of wealth, power, and stability. More than just a precious metal, it functions as a real-time indicator of global economic health—reacting to shifts in currency values, investor confidence, and geopolitical tensions. When people ask, “What is an ounce of gold worth today?” they’re not just seeking a number—they’re trying to understand a much larger financial narrative. The value of gold doesn’t sit still; it pulses with the rhythm of markets, central bank policies, and world events. From ancient empires to modern portfolios, gold has maintained its relevance, adapting seamlessly into contemporary investment strategies. This guide dives deep into the forces shaping gold’s current price, explores its historical journey, and unpacks why it remains a cornerstone of financial resilience across generations.
Live Gold Price: What is an Ounce of Gold Worth Right Now?

As of early 2025, the spot price for one troy ounce of gold trades within the range of **$2,000 to $2,100 USD**, though this figure changes by the minute based on global trading activity. The term “spot price” refers to the immediate market value of gold for prompt delivery, serving as the baseline for all gold-related transactions. Whether you’re buying bullion, evaluating jewelry, or tracking ETFs, this number is the starting point. Financial platforms and commodity exchanges like COMEX and the London Bullion Market Association (LBMA) provide live updates, reflecting supply and demand imbalances, currency movements, and macroeconomic data releases. For investors, watching these real-time fluctuations isn’t just informative—it can be strategic. A sudden spike during market turmoil or a dip following strong jobs data tells a story about where confidence lies in the broader economy.
Understanding Gold Measurements: Ounce, Gram, and Kilo Explained

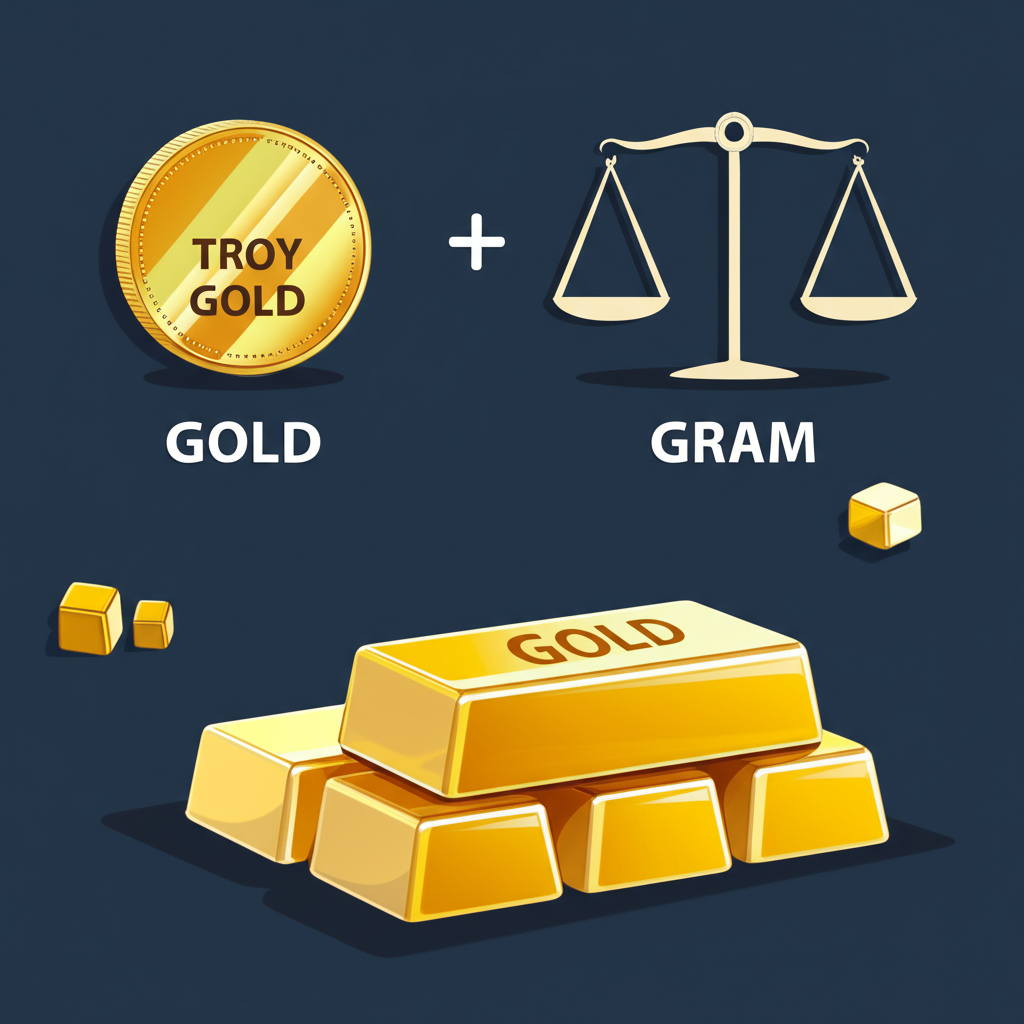
One of the most common sources of confusion in gold valuation lies in measurement. When someone says “an ounce,” they might mean the standard household ounce—but in the precious metals market, gold is measured in **troy ounces (ozt)**. A troy ounce equals approximately 31.1035 grams, making it about 10% heavier than the avoirdupois ounce used in everyday weighing. This distinction matters: miscalculating units can lead to significant pricing errors. Internationally, gold is also traded in grams and kilograms, especially in Asia and Europe. For example, a kilogram bar—weighing roughly 32.15 troy ounces—is popular among institutional buyers and large-scale investors. Knowing how to convert between these units ensures accuracy whether you’re purchasing a small 1-gram gold wafer or a 1-kilogram investment bar.
| Unit | Equivalent in Grams | Equivalent in Troy Ounces |
|---|---|---|
| 1 Troy Ounce | 31.1035 grams | 1 ozt |
| 1 Gram | 1 gram | 0.03215 ozt |
| 1 Kilogram | 1000 grams | 32.1507 ozt |
Gold Purity Explained: What is 24K Gold Worth Per Ounce?

Purity is just as critical as weight when determining value. Gold’s fineness is measured in karats (K), with 24K representing nearly pure gold—typically 99.9% or higher. This level of purity defines investment-grade bullion and sovereign coins like the American Gold Eagle or the Canadian Maple Leaf. Lower karat ratings indicate alloys mixed with metals like copper, silver, or nickel, which enhance durability but reduce intrinsic value. For instance, 22K gold is 91.67% pure, commonly used in traditional jewelry such as South African Krugerrands, while 18K gold contains only 75% gold. Consequently, the market value of any gold item must be adjusted to reflect its actual gold content. An ounce of 18K gold, therefore, would be priced at 75% of the current 24K spot rate. Understanding this adjustment is essential when selling scrap jewelry or comparing international products with varying standards.
Historical Gold Price Trends: A Look Back at Gold’s Journey Through Time
Gold’s price history reads like a chronicle of human civilization’s economic turning points. For centuries, gold backed currencies and anchored financial systems, most notably under the gold standard and later the Bretton Woods agreement, which tied global currencies to the U.S. dollar—and the dollar to gold. That link was severed in 1971 when President Nixon ended dollar convertibility into gold, unleashing a new era of free-floating prices. Since then, gold has experienced dramatic swings driven by inflation, war, and financial crises. In the late 1970s, soaring oil prices and double-digit inflation pushed gold from under $200 to over $800 per ounce by 1980 (equivalent to over $3,000 today when adjusted for inflation). After decades of consolidation, gold surged again following the 2008 financial crisis, breaking $1,000 in 2009 and steadily climbing through the 2010s. The pandemic-driven economic shock of 2020 reignited investor demand, sending prices to new nominal highs.
Key Moments: Understanding Gold’s Peaks and Troughs
Each major peak in gold’s price chart corresponds to a moment of systemic stress. In August 2020, amid lockdowns, central bank liquidity floods, and collapsing bond yields, gold reached an all-time high above **$2,070 per ounce**. A similar milestone was retested in late 2023 and early 2024 as inflation remained stubbornly high and geopolitical risks intensified—from the war in Ukraine to rising U.S.-China tensions. Earlier surges tell parallel stories: the early 1980s rally reflected fear of currency devaluation and Cold War anxieties; the post-2008 rise stemmed from loss of trust in banks and financial instruments. On the flip side, prolonged periods of economic expansion—such as the late 1990s tech boom or the mid-2010s recovery—often saw gold stagnate or decline, as investors rotated into higher-yielding assets. These cycles underscore gold’s identity not as a growth asset, but as a protector of capital during uncertain times.
What Drives Gold’s Value? Key Factors Influencing Its Price
The price of gold is shaped by a dynamic mix of economic fundamentals, psychological sentiment, and structural market forces. Unlike stocks or bonds, gold produces no income, so its value hinges entirely on perception—what investors believe it will be worth tomorrow. To truly grasp what an ounce of gold is worth today, one must examine the underlying currents that move markets behind the scenes.
Economic Indicators: Inflation, Interest Rates, and Dollar Strength
Three interconnected macroeconomic indicators play a dominant role in gold pricing. First, **inflation** acts as a primary catalyst. When consumer prices rise and fiat currencies lose purchasing power, gold often gains appeal as a tangible store of value. Historical data shows strong correlations between inflation spikes and gold rallies, particularly when real interest rates turn negative. Second, **interest rates** influence opportunity cost. As central banks raise rates, income-generating assets like Treasury bonds become more attractive, reducing gold’s relative appeal. Conversely, rate cuts or prolonged low-rate environments boost gold’s competitiveness. Third, the **U.S. dollar** exerts powerful influence because gold is globally priced in USD. A stronger dollar makes gold more expensive for foreign buyers, potentially suppressing demand. A weaker dollar does the opposite, often triggering inflows. According to the Federal Reserve, monetary policy decisions directly affect both interest rates and exchange rates, making them pivotal to gold’s trajectory.
Geopolitical Events & Market Uncertainty
When wars erupt, governments face instability, or global trade teeters on collapse, investors instinctively turn to gold. Its status as a **safe-haven asset** is rooted in history—gold retains value even when institutions fail. During the 2022 Russian invasion of Ukraine, gold prices jumped nearly 4% in a single week. Similarly, escalating Middle East conflicts or fears of a U.S.-China military confrontation have repeatedly triggered safe-haven bids. Even political uncertainty within major economies—such as elections with unpredictable outcomes—can increase demand. Unlike equities or corporate debt, gold carries no default risk and isn’t tied to any single nation’s fiscal health, which enhances its appeal during crises.
Supply & Demand Dynamics: Mining, Central Banks, and Consumer Use
While macro trends dominate headlines, fundamental supply and demand also shape gold’s price. Annual mine production contributes roughly 80–100 million ounces globally, but discoveries are becoming rarer and extraction more costly. Disruptions—like labor strikes in South Africa or regulatory changes in Latin America—can tighten supply. On the demand side, several forces converge. **Jewelry** accounts for nearly half of global consumption, particularly in India and China, where cultural traditions drive seasonal buying. **Industrial use**, though smaller, includes applications in electronics, aerospace, and dentistry due to gold’s conductivity and corrosion resistance. Most significantly, **central banks** have emerged as consistent net buyers. According to the World Gold Council, central bank gold purchases hit record levels in 2022 and remained strong through 2024, led by countries like China, Turkey, and Poland seeking to diversify away from the U.S. dollar.
Gold as an Investment: Why People Buy Gold and Its Role in Portfolios
Gold occupies a unique space in modern investing. It’s neither a productive asset like a business nor a debt instrument like a bond, yet millions include it in their portfolios for one key reason: **protection**. Financial advisors often recommend allocating 5% to 10% of a portfolio to gold to hedge against unexpected shocks. It performs particularly well during “regime shifts”—times when traditional assumptions about growth, inflation, or currency stability break down. For example, during the 2008 crisis, while equities plunged, gold gained over 5% for the year. Over longer horizons, gold has preserved wealth across generations, maintaining its purchasing power even as paper currencies have eroded. Additionally, its low correlation with stocks and bonds means it often moves independently, enhancing portfolio diversification and smoothing overall returns.
Physical Gold vs. Paper Gold: Understanding Your Investment Options
Investors can access gold in multiple ways, each with distinct advantages and trade-offs. The choice often comes down to control, convenience, and risk tolerance.
**Physical gold** includes bullion bars, coins, and collectibles. Owning physical gold means holding an asset with no counterparty risk—you don’t rely on a bank, broker, or custodian to honor a claim. This direct ownership offers peace of mind, especially during systemic financial stress. However, it also requires secure storage, insurance, and often involves paying a premium above the spot price. For instance, a 1 oz Gold Bar price today might be $50 to $100 above the spot rate, depending on the brand, distributor, and market conditions.
In contrast, **paper gold** provides exposure without handling metal. Gold ETFs, such as SPDR Gold Shares (GLD), track the price of gold and trade like stocks, offering high liquidity and low entry costs. Futures contracts allow leveraged bets on future prices, popular among traders. Shares in gold mining companies offer indirect exposure, though their performance is also tied to operational risks and equity market trends. While convenient, paper gold introduces counterparty risk and potential tracking discrepancies.
| Investment Type | Pros | Cons |
|---|---|---|
| Physical Gold (Bars, Coins) | Direct ownership, no counterparty risk, tangible asset | Storage costs, insurance, less liquid, premiums |
| Gold ETFs | High liquidity, easy trading, low storage cost | No direct ownership, counterparty risk, management fees |
| Gold Futures | Leverage potential, high liquidity | High risk, complex, margin calls |
What Does an Ounce of Gold Look Like? Visualizing Its Tangible Value
Despite its high market value, a troy ounce of gold is remarkably compact. Its density—nearly 19.3 grams per cubic centimeter—means that even a small piece feels substantial in hand. A typical one-ounce bullion coin, such as the American Gold Eagle, measures about 32–33 mm in diameter and 2–3 mm thick—slightly larger than a U.S. quarter but noticeably heavier, weighing in at exactly 31.1035 grams. The color is a rich, saturated yellow, with a lustrous finish that catches the light. A 1-ounce gold bar, meanwhile, is often molded into a slim rectangular shape—sometimes as small as 28mm × 16mm × 1.7mm—making it easy to conceal yet impossible to ignore once held. Its weight defies expectations, delivering a visceral sense of density and permanence. Holding an ounce of gold isn’t just a financial experience; it’s a physical reminder of wealth in its purest, most concentrated form.
Future Outlook: Will Gold Hit $5000 an Ounce? Expert Predictions and Market Scenarios
The idea of gold reaching **$5,000 per ounce** may sound extreme, but it’s not dismissed outright by seasoned analysts. Such a move would represent a more than doubling of current levels, requiring extraordinary conditions. Proponents of this bullish scenario point to several structural trends: persistently high government debt levels, ongoing central bank balance sheet expansion, and increasing de-dollarization efforts by emerging economies. If inflation becomes entrenched or confidence in fiat currencies erodes significantly, gold could see unprecedented inflows. Some macro investors argue that in real terms—adjusted for inflation—gold has not yet surpassed its 1980 peak.
However, skeptics caution that a $5,000 price tag demands more than just moderate stress. Sustained economic growth, rising real interest rates, or a strong, stable U.S. dollar could cap gains. Moreover, while central banks are buying, retail and institutional investment flows would need to surge to support such a rally. Historical precedent shows that gold tends to rise in waves rather than in a straight line, with long consolidation periods between peaks. While no one can forecast the future with certainty, monitoring indicators like real yields, central bank activity, and geopolitical developments will be key. Reputable sources such as Bloomberg and LBMA offer regular analysis on evolving market sentiment, helping investors stay informed amid speculation.
Conclusion: Maximizing Your Understanding of Gold’s True Worth
Determining what an ounce of gold is worth involves far more than checking a live ticker. It requires understanding centuries of economic evolution, the mechanics of global finance, and the psychology of markets. Gold’s value emerges from its rarity, durability, and universal acceptance—qualities that have preserved its role from ancient bazaars to digital trading floors. Whether you’re evaluating an inheritance, building a resilient portfolio, or simply satisfying curiosity, recognizing the factors that influence gold—its purity, measurement, and market drivers—empowers smarter decisions. From inflation hedging to crisis protection, from physical possession to financial instruments, gold remains a multifaceted asset with timeless relevance. By combining historical insight with real-time awareness, investors can navigate its fluctuations with greater clarity and confidence.
Frequently Asked Questions About Gold’s Value
1. How much is 1 oz of gold worth now?
The value of 1 troy ounce of gold fluctuates constantly based on global market conditions. You can find the real-time spot price on financial news websites or precious metals dealer platforms. As a general reference, it has recently been in the range of $2,000 to $2,100 USD per troy ounce.

留言