
Introduction to the Cup and Handle Pattern

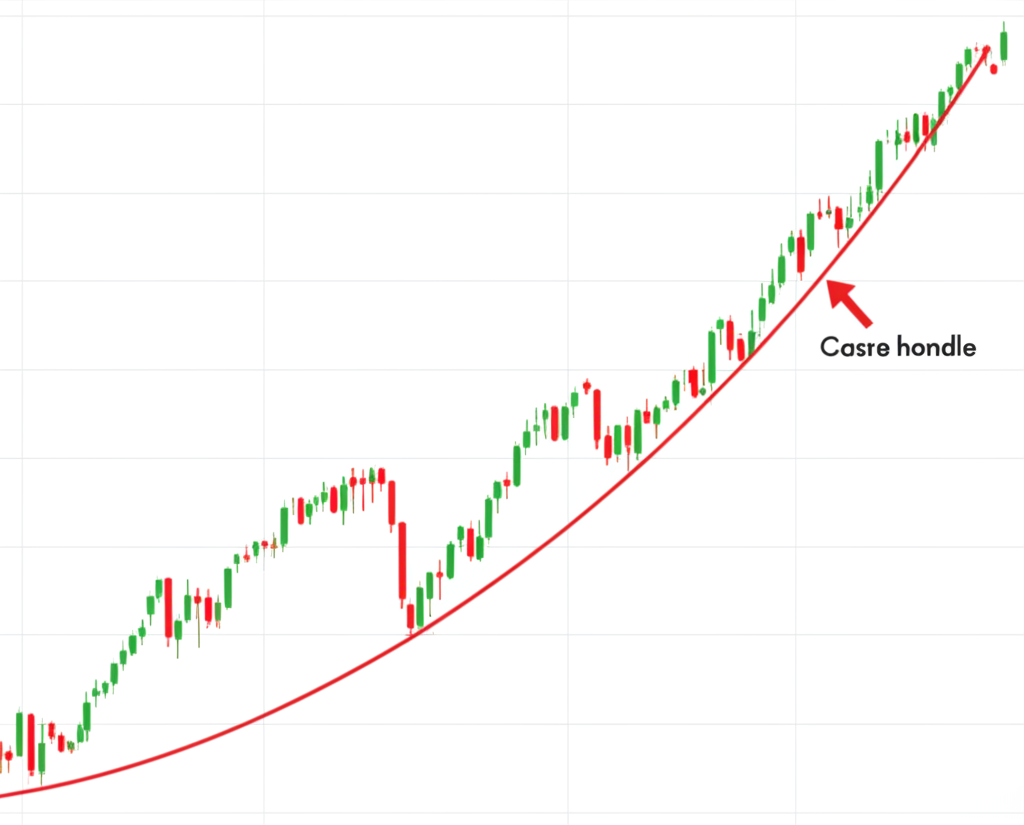
The cup and handle pattern stands as one of the most respected bullish continuation formations in technical analysis. First introduced by William J. O’Neil in his influential book *How to Make Money in Stocks*, this pattern captures a market pause—a period of consolidation—before an established uptrend resumes. Visually, it resembles a teacup on a chart, with the “cup” representing a rounded correction and the “handle” a final shakeout before momentum pushes higher. For traders aiming to spot high-conviction opportunities, mastering this formation can offer a strategic edge. This comprehensive guide breaks down the essential rules for identifying, confirming, and trading the cup and handle pattern with precision, equipping you with the tools to leverage its full potential in real-world markets.
Understanding the Core Components: Cup, Handle, and Volume
A legitimate cup and handle structure is built on three foundational elements: the cup, the handle, and the accompanying volume profile. Each plays a critical role in determining the strength and reliability of the pattern. Recognizing how these components interact allows traders to distinguish strong setups from misleading chart noise.
The Cup: Shape, Depth, and Duration Requirements
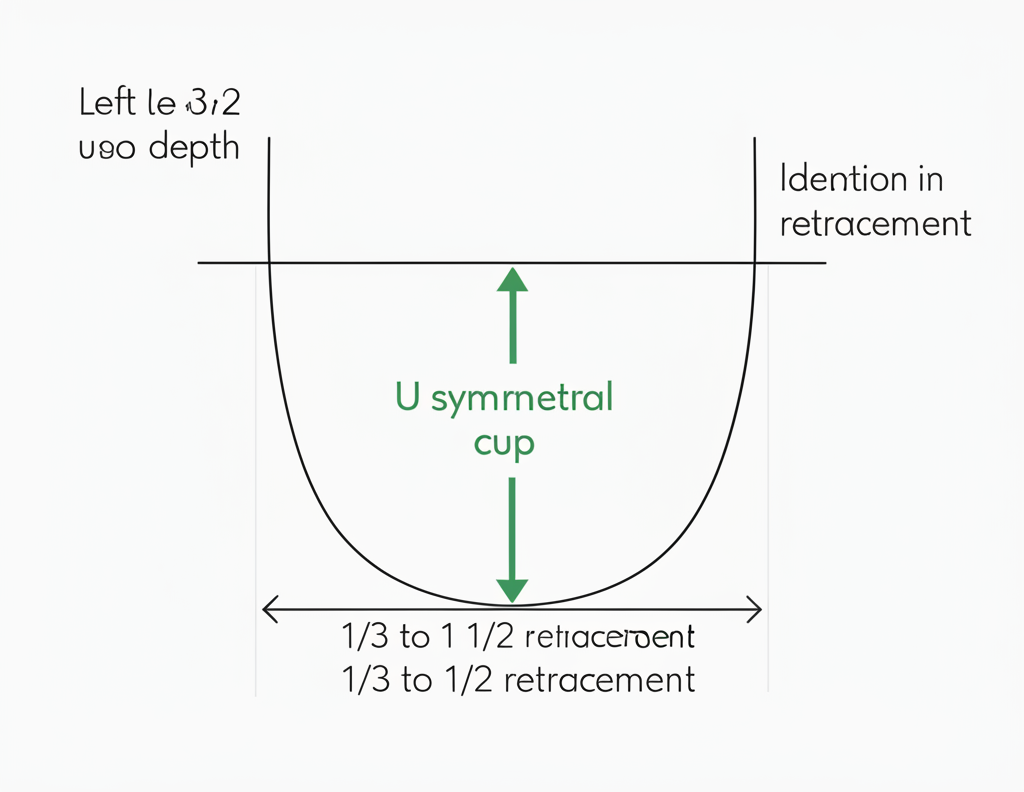
The cup serves as the base of the entire pattern and ideally takes the shape of a smooth, rounded “U” rather than a sharp “V.” A U-shaped bottom reflects gradual selling exhaustion and steady accumulation, signaling a healthy and deliberate consolidation. In contrast, a V-shaped decline often indicates panic selling and a rapid reversal, which lacks the structural integrity needed for a high-probability breakout.
Depth is another key factor. The pullback during the cup formation should generally retrace no more than 30% to 50% of the prior upward move. A retracement exceeding 50%—especially in the 70–80% range—raises concerns about underlying weakness and diminishes the bullish outlook. The duration of the cup varies widely, commonly lasting from one to six months, though some can extend beyond a year. Longer formation periods often correlate with stronger and more sustainable breakouts, as they reflect prolonged institutional accumulation. According to Investopedia, these extended bases can serve as powerful springboards for significant price advances, reinforcing the importance of patience in pattern recognition Investopedia.
The Handle: Formation, Slope, and Volume Characteristics
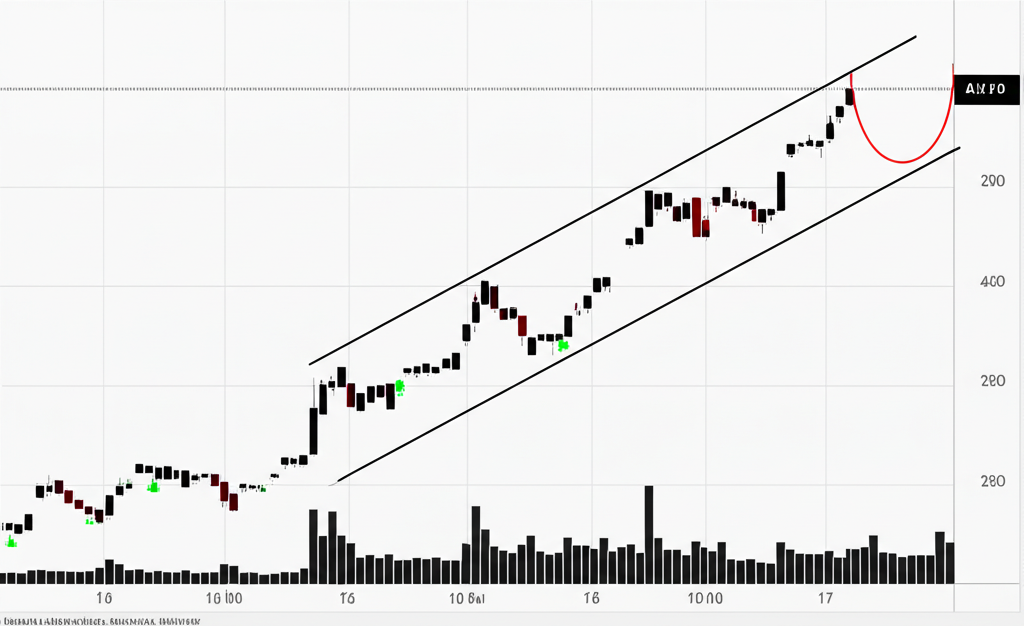
Following the completion of the cup, price enters a secondary consolidation phase known as the handle. This typically appears as a shallow downtrend, sideways drift, or a small flag/pennant along the upper portion of the cup. The handle acts as a final test of demand, allowing weak hands to exit before the next leg up.
For the pattern to remain valid, the handle should retrace no more than one-third of the cup’s depth and must stay within the upper half of the formation. A deeper pullback suggests lingering selling pressure and increases the risk of failure. Most handles form over one to four weeks, reflecting short-term profit-taking rather than a broad distribution phase. Crucially, volume during this phase should contract noticeably compared to earlier stages, indicating waning selling interest and a quiet build-up of buying pressure ahead of a potential breakout.
The Role of Volume: Confirmation and Validation
Volume serves as the ultimate validator of the cup and handle pattern. Without proper volume signals, even a well-formed structure can lead to false breakouts. As price descends into the bottom of the cup, volume should gradually decline, showing that selling momentum is fading. On the ascent up the right side of the cup, volume may begin to pick up, especially as price nears the previous resistance level—the “rim” of the cup—suggesting renewed investor interest.
During the handle formation, volume should remain subdued, reinforcing the idea of a low-pressure consolidation. However, the most critical volume signal occurs at the breakout. A decisive move above the handle’s resistance must be accompanied by a sharp increase in trading activity. This surge confirms strong institutional buying and significantly increases the odds of a sustained upward move. Conversely, a breakout on weak volume is inherently suspect and often reverses quickly, trapping optimistic traders.
The Definitive Rules for Identifying a Valid Cup and Handle Pattern
To avoid false signals and maximize trading accuracy, traders must apply strict criteria when evaluating potential cup and handle formations. These rules help separate robust, high-probability setups from visually similar but structurally weak patterns.
Rule 1: Prior Uptrend Confirmation
The cup and handle is, by definition, a continuation pattern. It only holds meaningful predictive power when it follows a clear and measurable uptrend. This preceding advance should demonstrate genuine momentum—ideally a rise of at least 30% or more over several weeks or months. Without this context, the pattern loses its directional bias and may instead represent a reversal or a neutral consolidation zone, which carries different trading implications.
Rule 2: Cup Shape and Depth Integrity
A valid cup must exhibit a rounded, U-shaped profile with balanced left and right sides. Symmetry enhances reliability, as it suggests orderly supply and demand dynamics. The depth of the retracement should remain within the 30–50% range of the prior move, with shallower pullbacks (closer to 30–40%) generally preferred. Deep corrections undermine confidence in the pattern’s bullish thesis and may reflect distribution rather than accumulation.
Rule 3: Handle Formation and Retracement Limits
The handle must develop after the cup completes and should remain confined to the upper third to upper half of the cup’s range. A retracement deeper than 50% of the cup’s depth is a red flag, often signaling that bears still control the price action. While most handles slope slightly downward, reflecting minor profit-taking, some may form as tight sideways ranges. An upward-sloping handle is less common and typically carries higher risk, as it may indicate aggressive buying that hasn’t yet been tested. StockCharts.com notes that optimal handle retracements fall between 10% and 15%, with anything beyond 50% considered a potential failure signal StockCharts.com.
Rule 4: Volume Analysis Throughout the Pattern
Volume must align with each phase of development. Declining volume during the cup’s bottom and handle formation shows reduced selling pressure. The breakout, however, demands a strong volume spike—ideally 40–50% above the average—to confirm institutional participation. This surge acts as a filter against false moves and increases confidence in the breakout’s sustainability. Traders who ignore volume do so at their own risk.
Rule 5: Time Frame Considerations
While the cup and handle pattern can appear on any chart—hourly, daily, or weekly—its significance grows with the time frame. Patterns on daily and weekly charts tend to produce more reliable outcomes due to stronger participation and reduced noise. Shorter time frames, like 4-hour or 15-minute charts, can yield valid signals but are more prone to whipsaws and false breakouts. For most traders, the daily chart offers the best balance of clarity and opportunity. When asked, “What time frame is best for cup and handle pattern?” seasoned analysts consistently point to daily and weekly cycles for higher-probability results.
Trading Strategies: Entry, Target, and Stop-Loss
Identifying the pattern is only the first step. A disciplined trading plan defines how to act on the signal while managing risk effectively.
Optimal Entry Points: The Breakout
The ideal entry occurs when price clears the highest point of the handle with conviction and strong volume. This breakout level acts as a trigger for long positions. Some traders enter immediately upon the close above resistance, while others wait for a retest of that level, now functioning as support, to confirm strength. The retest strategy can reduce the risk of chasing a false move, though it may result in a slightly less favorable entry price.
Calculating Price Targets: “How to decide target in cup and handle pattern?”
A widely accepted method for projecting upside potential involves measuring the vertical depth of the cup—from its lowest point to the right rim—and adding that distance to the breakout point. For instance, if the cup drops from $100 to $80 (a $20 depth), and price breaks out at $100, the initial price target would be $120. This target serves as a baseline; traders may adjust it based on broader resistance zones, Fibonacci extensions, or market conditions.
Setting Stop-Loss Levels for Risk Management
Preserving capital is as important as capturing gains. A common stop-loss strategy is to place the stop just below the lowest point of the handle. This location makes logical sense—if price falls back into the handle, the consolidation has failed, and the breakout is invalidated. Alternatively, stops can be set below key support levels within the handle or beneath a relevant moving average, such as the 50-day EMA. The exact placement should reflect individual risk tolerance and the volatility of the asset.
Advanced Insights and Differentiated Applications
Beyond textbook definitions, experienced traders enhance their edge by understanding nuances, integrating complementary tools, and preparing for exceptions.
Common Pitfalls and How to Avoid Them
Even seasoned traders fall into traps when analyzing cup and handle patterns. One frequent error is accepting a V-shaped cup as valid, despite its lack of proper base-building. Another is overlooking a handle that extends too deeply into the cup, mistaking it for a healthy pullback. False breakouts are also common—price briefly surpasses resistance but quickly reverses. These can often be avoided by demanding strong volume on the breakout and waiting for a retest. Equally damaging is ignoring the necessity of a prior uptrend. Without it, the pattern lacks context and may mislead.
Integrating with Other Technical Indicators
Combining the cup and handle with additional technical tools increases the odds of success. For example, a breakout coinciding with RSI rising above 50—or approaching 70—signals strengthening momentum. A bullish MACD crossover or expanding histogram bars can further confirm upward pressure. Moving averages add another layer of validation: if the breakout occurs above the 50-day or 200-day MA, it reinforces the strength of the move. Fibonacci retracement levels can also help assess whether the handle’s pullback is within acceptable limits (e.g., staying above the 38.2% or 50% level of the cup).
Understanding Pattern Failure: “Cup and handle pattern failure”
Not every pattern leads to a successful breakout. Failure occurs when price breaks out but fails to sustain momentum, eventually falling back below the handle’s resistance or triggering the stop-loss. Causes include adverse news, sector weakness, or insufficient buying interest. Early warning signs include weak volume on the breakout, a failure to follow through the next day, or a quick reversal into the handle zone. Recognizing these signals promptly allows traders to exit with minimal loss and preserve capital for better opportunities.
Inverted Cup and Handle Pattern: Rules and Implications
The inverted cup and handle is the bearish counterpart, appearing after an uptrend and signaling a potential reversal. It features a rounded top (inverted U) followed by a small upward drift—the handle—that acts as resistance. The pattern completes when price breaks below the handle’s support with increased volume. Traders interpret this as a sign of distribution and may initiate short positions. The downside target is calculated by measuring the depth of the inverted cup and projecting it downward from the breakout point. While less common than the bullish version, it remains a valuable tool for spotting trend reversals in overextended markets.
Practical Examples and Case Studies
Imagine a stock, XYZ Corp, rising steadily from $70 to $100 over six months. After peaking, it declines gradually to $80, then climbs back to $100 over the next ten weeks, forming a smooth U-shaped cup with a $20 depth. Following this, the stock consolidates between $97 and $100 for three weeks, creating a small downward-sloping handle. Volume dries up during this phase. When XYZ breaks above $100 on a surge of volume, the cup and handle is confirmed. A trader enters at $100.05, sets a stop-loss at $96.50 (just below the handle’s low), and targets $120 based on the cup’s depth.
In a bearish scenario, a cryptocurrency rises from $20,000 to $30,000, then forms an inverted U, peaking at $30,000 and dropping to $24,000. It then rallies to $27,000—a failed retest of the high—forming the handle. When price breaks below $24,000 with strong volume, the inverted pattern is confirmed. Traders short the asset, targeting $18,000 (a $6,000 drop projected from the breakout point), aligning with the depth of the inverted cup.
Conclusion: Harnessing the Power of the Cup and Handle Pattern
The cup and handle pattern remains a cornerstone of technical trading for good reason. Its structured formation, clear visual cues, and reliance on volume confirmation make it one of the most reliable bullish continuation signals available. By adhering to strict identification rules—focusing on cup shape, handle depth, prior trend, and volume dynamics—traders can filter out noise and focus on high-quality setups. Pairing the pattern with sound risk management and complementary indicators further sharpens its predictive power. Whether trading stocks, forex, or cryptocurrencies, mastering this pattern provides a disciplined framework for capturing significant moves. For any trader committed to long-term success, understanding and applying the cup and handle strategy is not just useful—it’s essential.
Is cup and handle a bullish pattern, and why is it considered so?
Yes, the standard cup and handle pattern is definitively a bullish continuation pattern. It’s considered bullish because it forms after an established uptrend, signaling a period of healthy consolidation (the cup and handle) before the prior uptrend resumes. The breakout from the handle, especially with high volume, confirms that buying pressure has reasserted control, pushing prices higher.
What are the critical minimum requirements for a valid cup and handle pattern?
- Prior Uptrend: Must be preceded by a significant uptrend.
- Cup Shape: Ideally a “U” shape, not a “V”, with symmetrical sides.
- Cup Depth: Generally not more than 50% of the prior advance (1/3 to 1/2 is ideal).
- Handle Retracement: Must form in the upper half of the cup and not retrace more than 1/3 to 1/2 of the cup’s depth.
- Volume Confirmation: Volume should decline during cup/handle formation and surge dramatically on the breakout.
How do I accurately calculate the price target for a cup and handle pattern breakout?
The most common method is to measure the vertical distance from the bottom of the cup to the right-hand rim (the breakout level). This measured depth is then projected upwards from the point where the price breaks out above the handle’s resistance line. For example, if the cup is $15 deep and the breakout occurs at $50, the target price would be $65.
What time frame is best suited for identifying and trading the cup and handle pattern effectively?
While the pattern can appear on any timeframe, it tends to be more reliable and significant on longer timeframes. Daily and weekly charts are generally considered best for identifying and trading the cup and handle pattern, as they filter out much of the market noise and often lead to more substantial moves. Shorter timeframes (e.g., hourly) can be traded but may have higher instances of false breakouts.
留言