

Introduction: What Are Holding Costs and Why Do They Matter?
Holding costs, also known as inventory carrying costs, represent the full spectrum of expenses businesses face when storing unsold goods. These go far beyond simple warehouse rent—encompassing everything from capital tied up in stock to risks like spoilage and obsolescence. Every product sitting on a shelf carries an invisible price tag that grows over time, eating into profits and reducing financial flexibility. Understanding and managing these costs is critical for maintaining healthy cash flow, setting accurate prices, and making informed decisions about inventory strategy. In many industries, holding costs can consume 15% to 35% of inventory value annually, making them a major factor in overall profitability. This guide breaks down the components of holding costs, demonstrates how to calculate them with real-world examples, and explores their strategic implications across different sectors.
Understanding the Key Components of Holding Costs
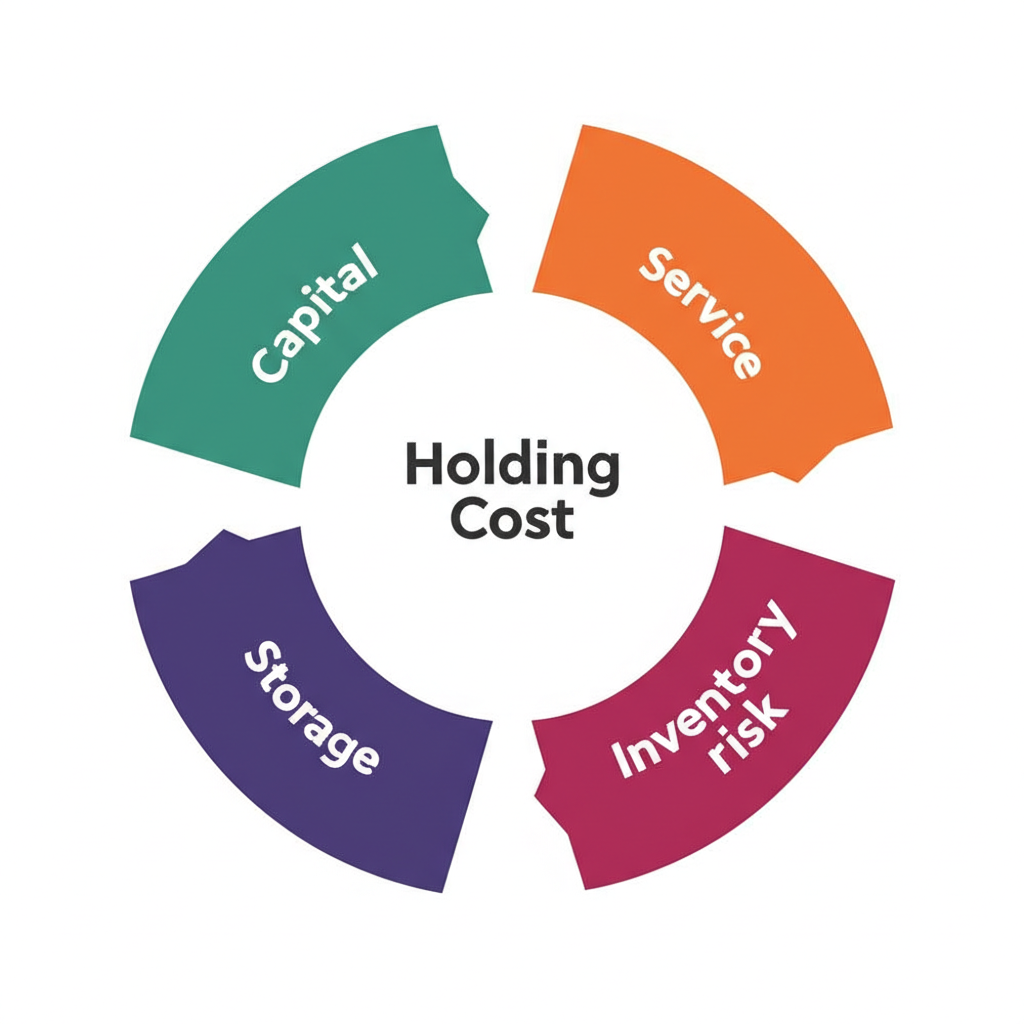
To truly grasp the financial burden of inventory, it’s essential to break down holding costs into their core components. While the exact mix varies by business, most fall into four main categories: capital, storage, service, and risk. Each contributes to the total cost of simply “holding” inventory, often in ways that are overlooked until they impact the bottom line.
Capital Costs
Perhaps the most significant yet least visible component is capital cost. This reflects the opportunity cost of money invested in inventory—money that could otherwise be earning returns elsewhere or used to reduce debt. If a company finances its inventory through loans, the interest paid is a direct expense. But even with internal funds, there’s an implied cost: the return that capital could have generated if deployed in alternative investments. For example, if a business uses its own funds to purchase $100,000 worth of inventory and its average return on investment is 8%, then $8,000 per year represents the foregone return—its capital cost. Recognizing this helps align inventory decisions with broader financial goals, as highlighted in discussions on cost of capital.
Storage Costs

These are the tangible, day-to-day costs of physical storage. They include:
* **Facility expenses:** Rent for leased space or depreciation and property taxes for owned warehouses.
* **Utilities:** Power for lighting, HVAC systems, refrigeration, and other climate control needs.
* **Labor:** Wages for employees involved in receiving, moving, organizing, picking, and packing inventory.
* **Equipment:** Depreciation, maintenance, and fuel for forklifts, conveyors, shelving, and automated systems used in material handling.
These costs are often the most noticeable but can be optimized through layout improvements, automation, or renegotiating lease terms.
Service Costs
Service costs involve the administrative and protective services required to manage inventory effectively. These ensure compliance, track stock levels, and safeguard assets. Key expenses include:
* **Insurance premiums:** Coverage against theft, fire, water damage, or other losses.
* **Taxes:** Property taxes assessed on the value of stored inventory in certain jurisdictions.
* **Technology investments:** Licensing, maintenance, and support for inventory management systems, barcode scanners, and tracking software.
While not always front-of-mind, these services are essential for accurate reporting and operational continuity.
Inventory Risk Costs

These costs reflect potential value erosion and are often underestimated. They include:
* **Obsolescence:** Products becoming outdated due to market trends, technology shifts, or seasonal changes.
* **Spoilage:** Perishable items like food, pharmaceuticals, or cosmetics losing value or becoming unusable over time.
* **Damage:** Goods harmed during handling, stacking, or storage due to accidents or environmental factors.
* **Shrinkage:** Losses from theft—either internal or external—or inventory discrepancies due to errors in counting or documentation.
* **Returns processing:** Labor and logistics involved in handling customer returns, restocking, or disposal.
Accurate forecasting, inventory rotation (like FIFO), and strong internal controls can significantly reduce these risks.
The Essential Holding Cost Formula
The most practical way to assess holding costs is to express them as a percentage of inventory value. This makes it easier to compare across periods and industries, and to integrate into financial models.
The standard formula for the annual holding cost percentage is:
**Holding Cost Percentage = (Total Annual Holding Costs) / (Average Annual Inventory Value)**
From there, you can calculate the actual dollar cost:
**Total Annual Holding Cost = Holding Cost Percentage × Average Annual Inventory Value**
Alternatively, to assess cost per item:
**Holding Cost Per Unit Per Year = Total Annual Holding Cost / Average Number of Units in Inventory**
**Key Definitions:**
* **Total Annual Holding Costs:** The sum of all capital, storage, service, and risk-related expenses over a year.
* **Average Annual Inventory Value:** Typically calculated as (Beginning Inventory Value + Ending Inventory Value) / 2. For greater precision, use monthly averages.
* **Holding Cost Percentage:** A benchmark metric. Many businesses operate with holding costs between 15% and 35% annually, though high-risk or capital-intensive industries may exceed this. Industry estimates consistently highlight this range as a common baseline.
Step-by-Step Guide: How to Calculate Holding Costs in Practice
A structured approach ensures accurate results and reveals actionable insights.
Step 1: Identify All Relevant Cost Components
Begin by compiling a comprehensive list of expenses related to holding inventory. This requires input from finance, operations, and warehouse teams. Be thorough—include both direct and indirect costs across the four categories: capital, storage, service, and risk.
Step 2: Quantify Each Cost Component
Assign a dollar value to each identified expense.
* **Capital Costs:** Use the company’s weighted average cost of capital (WACC) or loan interest rate, applied to the average inventory value.
* **Storage Costs:** Pull data from facility budgets, utility bills, payroll records, and equipment maintenance logs.
* **Service Costs:** Review insurance policies, tax assessments, and software subscription invoices.
* **Inventory Risk Costs:** Analyze historical data on write-offs, damaged goods reports, shrinkage audits, and return processing costs. Estimating obsolescence may require input from sales and product teams.
Step 3: Sum the Total Holding Costs
Add all individual costs to determine the total annual expenditure on holding inventory.
**Table 1: Example Cost Component Aggregation**
| Cost Category | Specific Expense | Annual Cost ($) |
| :——————– | :————————- | :————– |
| **Capital Costs** | Opportunity Cost of Capital | $15,000 |
| **Storage Costs** | Warehouse Rent | $10,000 |
| | Utilities | $2,000 |
| | Warehouse Labor | $8,000 |
| **Service Costs** | Inventory Insurance | $1,500 |
| | Inventory Taxes | $500 |
| | IT Systems | $1,000 |
| **Inventory Risk Costs** | Obsolescence/Spoilage | $3,000 |
| | Damage/Shrinkage | $2,000 |
| **TOTAL ANNUAL HOLDING COSTS** | **$43,000** | |
Step 4: Determine Average Inventory Value
Calculate the average inventory value for the same period. For example:
* Simple method: (Beginning Inventory Value + Ending Inventory Value) / 2
* More accurate: Average of monthly inventory valuations
Step 5: Calculate the Holding Cost Percentage
Divide the total annual holding costs by the average inventory value and multiply by 100:
**Holding Cost Percentage = (Total Annual Holding Costs / Average Annual Inventory Value) × 100%**
Practical Examples: Calculating Holding Costs
Let’s see how this works in real scenarios.
Example 1: Annual Inventory Holding Cost Calculation
A small electronics retailer evaluates its holding costs for the year.
**Data:**
* **Capital Costs:** $10,000
* **Storage Costs:**
* Warehouse Rent: $8,000
* Utilities: $1,500
* Labor: $6,000
* **Service Costs:**
* Insurance: $1,200
* Taxes: $300
* IT Systems: $800
* **Inventory Risk Costs:**
* Obsolescence/Damage: $4,000
* Shrinkage: $1,000
* **Average Annual Inventory Value:** $150,000
**Calculation:**
1. **Total Annual Holding Costs:**
$10,000 + $8,000 + $1,500 + $6,000 + $1,200 + $300 + $800 + $4,000 + $1,000 = **$32,800**
2. **Holding Cost Percentage:**
($32,800 / $150,000) × 100% = **21.87%**
This means nearly 22 cents of every dollar invested in inventory is spent on holding it annually.
Example 2: Calculating Holding Cost Per Unit
Using the same data, assume the retailer holds an average of 500 units per year.
**Calculation:**
1. **Total Annual Holding Cost:** $32,800
2. **Average Number of Units:** 500
3. **Holding Cost Per Unit Per Year:**
$32,800 / 500 = **$65.60 per unit**
This metric helps in pricing individual products and evaluating the cost-effectiveness of carrying slow-moving items.
Holding Costs in Broader Contexts: Beyond Inventory
While inventory is the most common context, holding costs apply to any asset that incurs ongoing expenses without generating immediate returns.
Holding Costs in Real Estate Investment
Real estate investors face holding costs while waiting to develop, sell, or lease a property. These can accumulate quickly and impact project viability.
* **Property Taxes:** Recurring municipal assessments.
* **Insurance:** Coverage for vacant or under-construction properties.
* **Utilities:** Basic services to maintain the property.
* **Maintenance:** Landscaping, repairs, and security.
* **Loan Interest:** Payments on acquisition or construction financing.
* **HOA Fees:** For condos or planned communities.
**Example:** An investor buys land for $200,000 with plans to build in two years. Annual taxes: $3,000, insurance: $500, and loan interest: $8,000. The annual holding cost is $11,500—money spent without any income in return.
Holding Costs in Manufacturing and Project Management
In manufacturing, work-in-progress (WIP) inventory ties up capital and space, incurring similar holding costs. In project management, idle equipment, standby labor, or delayed milestones extend resource allocation without progress, effectively creating holding costs. Recognizing these helps justify faster throughput, better scheduling, and leaner operations.
The Strategic Impact of Holding Costs and How to Reduce Them
High holding costs directly reduce net income and limit financial agility. Reducing them isn’t just about cutting expenses—it’s about smarter resource use.
Optimize Inventory Levels
* **Just-In-Time (JIT):** Receive inventory only when needed, minimizing storage time.
* **Demand Forecasting:** Use data analytics to align stock levels with actual customer demand.
* **Safety Stock Optimization:** Balance stockout risk with holding cost using statistical models.
* **Vendor-Managed Inventory (VMI):** Let suppliers monitor and replenish stock, shifting some cost burden.
Improve Storage Efficiency
* **Optimize Warehouse Layout:** Maximize vertical space and streamline workflow.
* **Invest in Automation:** AS/RS systems reduce labor and error rates while improving density.
* **Use Cross-Docking:** Transfer goods directly from inbound to outbound trucks, bypassing long-term storage.
Mitigate Risk Factors
* **Enhance Security:** Surveillance, access controls, and audits to reduce shrinkage.
* **Implement FIFO:** Especially for perishable or fashion-driven items.
* **Strengthen Quality Control:** Reduce damage through better handling and supplier standards.
* **Build Supplier Partnerships:** Improve reliability and shorten lead times, reducing the need for buffer stock.
Negotiate with Suppliers
* **Extend Payment Terms:** Delay cash outflow, reducing the capital cost component.
* **Shorten Lead Times:** Enable smaller, more frequent orders and lower average inventory.
Holding Costs and Economic Order Quantity (EOQ)
Holding costs are a core variable in the Economic Order Quantity (EOQ) model, which determines the optimal order size to minimize total inventory costs (ordering + holding).
**EOQ Formula:**
$EOQ = \sqrt{\frac{(2DS)}{H}}$
Where:
* D = Annual demand in units
* S = Cost per order
* H = Holding cost per unit per year
Here, ‘H’ is critical. If holding costs are high, EOQ decreases, favoring smaller, more frequent orders. If holding costs are low, larger orders become more economical. Accurate calculation of H ensures the EOQ model delivers meaningful, cost-saving recommendations.
Conclusion: Mastering Holding Costs for Business Success
Calculating holding costs is not just a finance exercise—it’s a strategic lever for improving profitability and operational efficiency. By dissecting the components of capital, storage, service, and risk, businesses uncover hidden drains on resources. Whether optimizing inventory with EOQ, redesigning warehouse operations, or applying the concept to real estate or project timelines, proactive management of holding costs leads to better cash flow, reduced waste, and smarter decision-making. In a competitive market, those who control their holding costs gain a significant edge—freeing up capital, improving agility, and building a more resilient financial foundation.
What is the basic formula for calculating holding cost?
The basic formula for calculating the annual holding cost percentage is: (Sum of all annual holding costs) / (Average Annual Inventory Value). To find the total annual holding cost, you multiply this percentage by the Average Annual Inventory Value.
How do I calculate the annual holding cost for my inventory?
To calculate the annual holding cost:
- Identify and sum all annual expenses related to holding inventory (capital, storage, service, and risk costs).
- Determine the average monetary value of your inventory over the year.
- Divide the total annual holding costs by the average annual inventory value to get the holding cost percentage.
- Multiply this percentage by the average annual inventory value to get the total annual holding cost in dollars.
What is the difference between holding cost and inventory carrying cost?
There is no practical difference; the terms “holding cost” and “inventory carrying cost” are used interchangeably to refer to the expenses associated with storing and maintaining inventory over a period.
Can you provide a practical example of how to calculate holding cost per unit?
Certainly. If your total annual holding costs are $32,800 and your average annual inventory consists of 500 units, the holding cost per unit per year would be $32,800 / 500 units = $65.60 per unit per year.
How do holding costs influence the Economic Order Quantity (EOQ) model?
Holding costs are a critical input in the EOQ formula. A higher holding cost per unit (H) will result in a lower Economic Order Quantity, suggesting that it’s more cost-effective to place smaller, more frequent orders to minimize the expenses of storing inventory.
What are the major categories of expenses that make up holding costs?
The major categories are:
- Capital Costs: Opportunity cost of capital tied up in inventory.
- Storage Costs: Warehouse rent, utilities, labor, equipment.
- Service Costs: Inventory insurance, taxes, IT systems for tracking.
- Inventory Risk Costs: Obsolescence, spoilage, damage, shrinkage, theft.
Why is it important for businesses to accurately calculate their holding costs?
Accurate calculation of holding costs is vital because it:
- Reveals hidden costs that erode profitability.
- Informs inventory management strategies (e.g., EOQ, JIT).
- Helps optimize cash flow by reducing capital tied up in inventory.
- Supports pricing decisions and budget planning.
- Identifies areas for operational efficiency improvements.
What are effective strategies to reduce overall holding costs in a warehouse?
Effective strategies include:
- Optimizing inventory levels through better demand forecasting and JIT practices.
- Improving warehouse layout and using automation for efficient storage.
- Mitigating risk factors like obsolescence and shrinkage through better security and inventory rotation.
- Negotiating favorable payment terms and shorter lead times with suppliers.
Are holding costs only applicable to inventory, or do they apply to other assets?
While most commonly associated with inventory, the concept of holding costs applies to other assets as well. For example, in real estate, holding costs include property taxes, insurance, utilities, and maintenance for properties awaiting sale or development. In manufacturing, work-in-progress (WIP) or idle equipment can also incur holding costs.
How can I estimate the capital cost component of my inventory holding costs?
You can estimate capital cost by using your company’s cost of capital (e.g., weighted average cost of capital, or the interest rate on borrowed funds) and applying it to the average monetary value of your inventory. This represents the opportunity cost of having that capital tied up in inventory instead of being invested elsewhere or used to pay down debt.
留言