
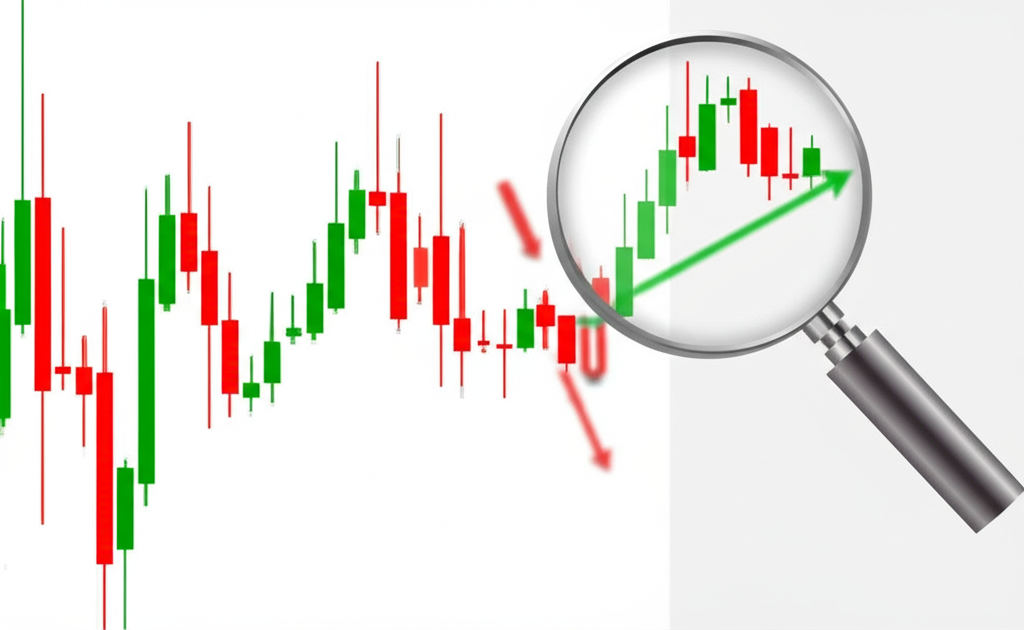
Understanding the Head and Shoulders Top Formation
Technical analysis remains a foundational approach for forecasting market movements, leveraging historical price and volume data to anticipate future trends. Among the vast array of chart patterns, the Head and Shoulders Top stands out as one of the most widely recognized and trusted reversal signals. When this formation emerges at the peak of an uptrend, it often marks the turning point where bullish momentum gives way to bearish control. This shift isn’t just a minor correction—it typically signals the end of an upward trend and the beginning of a sustained downward move. Traders and investors who can accurately identify this pattern gain a strategic advantage in timing exits or initiating short positions. Its reliability stems not only from its visual clarity but also from the underlying market psychology it reflects: a gradual loss of buying strength and the rising dominance of sellers.

What Is the Head and Shoulders Top Pattern?
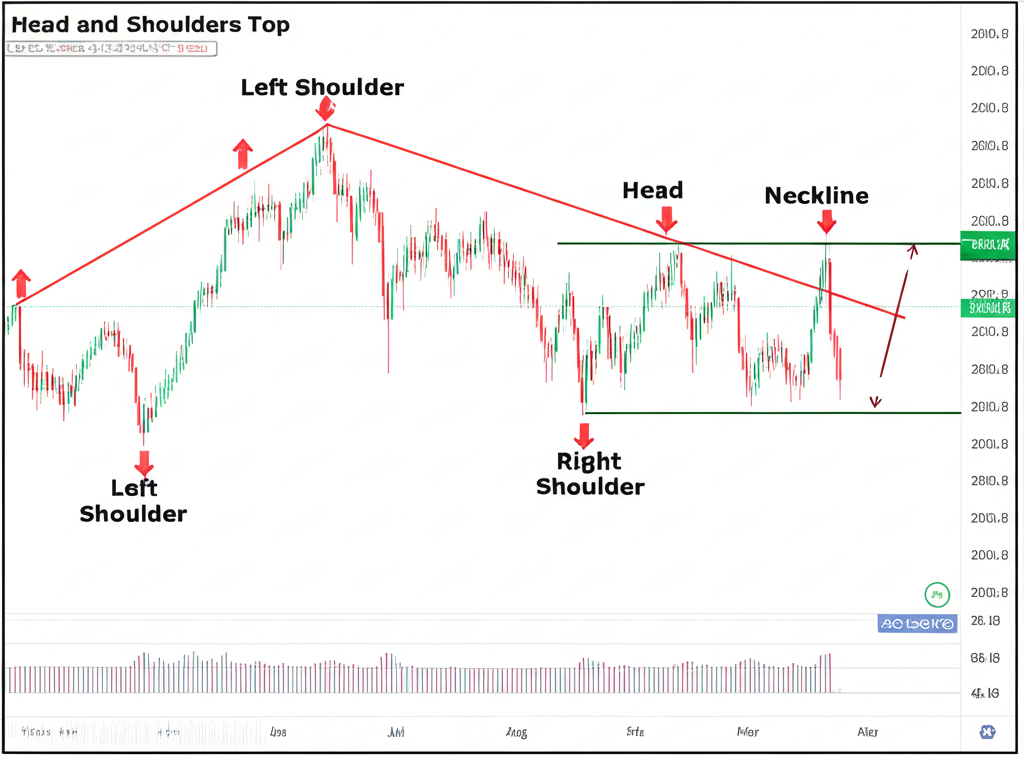
The Head and Shoulders Top pattern is a bearish reversal formation that typically appears after a prolonged upward trend. It consists of three distinct peaks: the first and third are roughly equal in height, while the middle peak rises higher than both, creating a shape that resembles a human head flanked by two shoulders. This visual structure is more than just a coincidence—it reflects a real shift in market dynamics. As prices struggle to reach new highs and volume begins to dry up, the pattern reveals weakening demand and growing distribution by large players. Because it captures such a clear transition in supply and demand, the Head and Shoulders Top is considered one of the most dependable signals in technical analysis for predicting trend reversals.
Anatomy of the Head and Shoulders Top
To effectively use this pattern, traders must understand each of its components and how they contribute to the overall signal:
- Left Shoulder: This forms during the final stages of an uptrend, where strong buying interest pushes prices to a new high before pulling back. The correction that follows often occurs on reduced volume, suggesting early signs of hesitation among buyers.
- Head: After the pullback, prices surge again, surpassing the high of the left shoulder and forming the highest peak in the sequence. This move may still attract buyers, but the subsequent decline tends to be sharper and deeper, returning to a level near the previous low. Volume during this phase may remain steady or begin to decline, indicating less conviction behind the new high.
- Right Shoulder: Following the drop from the head, another rally attempts to carry prices higher—but fails to reach the peak of the head. This lower high is a critical warning sign, showing that upward momentum is fading. Importantly, this final push often occurs on significantly lower volume, confirming buyer exhaustion.
- Neckline: This line connects the two troughs formed after the left shoulder and the head. It acts as a support level, and its slope can offer additional insight—downward-sloping necklines are generally more bearish, while horizontal or slightly upward-sloping ones may suggest a more gradual shift in sentiment.
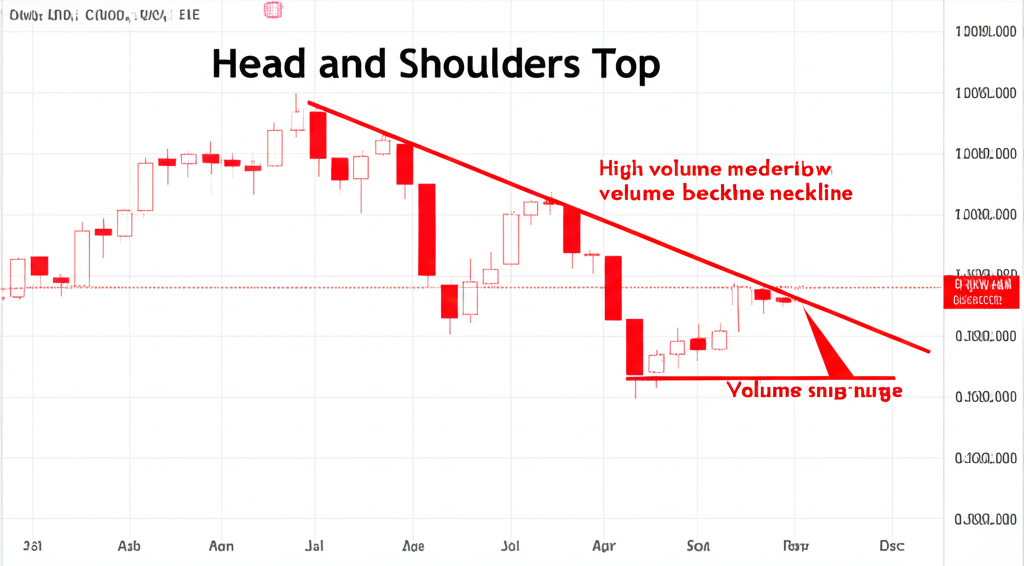
- Volume: Perhaps one of the most telling aspects of the pattern is volume behavior. Ideally, volume should be strong during the left shoulder, moderate during the head, and noticeably weaker during the right shoulder. A sharp increase in volume as price breaks below the neckline adds powerful confirmation that sellers are now in control.
How to Identify a Head and Shoulders Top Pattern
Spotting this pattern requires a methodical approach that combines visual analysis with volume confirmation. Here’s how to do it step by step:
- Verify the prior uptrend: The pattern only holds meaning if it appears after a clear, established upward trend. Without a trend to reverse, the formation lacks context and predictive power.
- Look for three distinct peaks: Identify the left shoulder, the higher head, and the right shoulder, which should be lower than the head and roughly equal in height to the left shoulder. The symmetry between the shoulders enhances the reliability of the pattern.
- Draw the neckline accurately: Connect the two lowest points between the peaks—the trough after the left shoulder and the trough after the head. This line serves as the key level to watch for confirmation.
- Monitor volume trends: As the pattern develops, volume should show a clear decline on each successive rally. Lower volume during the right shoulder suggests diminishing enthusiasm from buyers, increasing the likelihood of a reversal.
- Wait for neckline breakdown: The pattern is not confirmed until price closes decisively below the neckline. A strong downward candle accompanied by a surge in volume increases confidence in the signal. A false break—where price briefly dips below and then recovers—can trap unwary traders, so waiting for a solid close is essential.
Market Psychology Behind the Pattern
The true strength of the Head and Shoulders Top lies in what it reveals about investor sentiment. During the left shoulder, optimism is still strong—buyers are confident and active. The formation of the head shows one final attempt to push prices higher, often fueled by latecomers or momentum traders. However, the deeper correction that follows indicates that sellers are stepping in more aggressively. When the right shoulder forms at a lower high, it becomes clear that demand is weakening. At this stage, early buyers may begin taking profits, while new participants hesitate to enter. The final breakdown below the neckline often triggers stop-loss orders and accelerates selling, marking the point where bears take full control. This psychological shift—from greed to caution to fear—is what gives the pattern its predictive edge.
Trading Strategies for the Head and Shoulders Top
Traders use this formation to time short entries or exit long positions before a downtrend accelerates. The key is to balance opportunity with risk management.
Entry Strategies
- Conservative approach: Enter a short position after price closes below the neckline on strong volume. This confirms the breakdown and reduces the risk of false signals.
- Aggressive approach: Some traders may initiate a partial short during the formation of the right shoulder, especially if volume is low and price shows signs of stalling. However, this carries greater risk and should be done with tight risk controls.
Stop-Loss Placement
Protecting capital is crucial. A common stop-loss level is placed just above the high of the right shoulder. Alternatively, placing the stop above the neckline can also be effective, especially if the neckline is sloping upward. Either way, the stop should be set before entering the trade to enforce discipline.
Price Target Calculation
The projected downside target is calculated by measuring the vertical distance from the top of the head to the neckline. This distance is then subtracted from the neckline breakout point. For instance, if the head reaches $120 and the neckline sits at $100, the measured move is $20. If price breaks down from $100, the target would be $80. While not a guaranteed outcome, this target provides a realistic expectation for the potential extent of the decline.
Risk Management Tips
- Limit exposure by risking no more than 1–2% of trading capital per trade.
- Adjust position size based on the distance between entry and stop-loss to maintain consistent risk.
- Use the pattern as part of a broader strategy—don’t rely on it in isolation.
Common Mistakes to Avoid
- Entering too early: Jumping into a short before the neckline break can lead to losses if the pattern fails.
- Ignoring volume: A breakdown without volume support is less reliable. Always check volume trends for confirmation.
- Incorrect neckline drawing: Misplacing the neckline can distort the target and lead to poor decision-making. Use clear swing lows to define it.
- Misreading false breakdowns: Prices may dip below the neckline and rebound. Wait for a sustained close below and, ideally, a retest of the neckline as resistance to confirm the reversal.
Inverse Head and Shoulders: The Bullish Twin
Just as the Head and Shoulders Top signals the end of a bull run, its mirror image—the Inverse Head and Shoulders—marks a potential bottom in a downtrend. This bullish reversal pattern consists of three troughs: the middle one is the deepest (the head), flanked by two shallower troughs (the shoulders). The inverse neckline connects the two reaction highs between them. When price breaks above this neckline on strong volume, it suggests that selling pressure has dried up and buyers are stepping in. While the formation is inverted, the underlying psychology is the same: a shift from selling dominance to buying control. Recognizing both versions allows traders to spot turning points in any market condition.
Reliability and Limitations
The Head and Shoulders Top is widely respected for its accuracy, particularly when it appears on daily or weekly charts. Its structured progression and volume clues make it easier to interpret than many other patterns. However, no technical signal is infallible. False breakdowns can occur, especially in choppy or low-volume markets. The pattern may also take time to fully develop, requiring patience from traders. For best results, it should be used alongside other tools such as moving averages, RSI, or MACD to confirm weakening momentum or trend strength. Additionally, external factors like earnings reports or macroeconomic news can override even the clearest chart patterns, so staying aware of the broader market environment is essential.
Conclusion: Mastering the Head and Shoulders Top
The Head and Shoulders Top is more than just a shape on a chart—it’s a narrative of shifting market power. From the final gasp of bullish enthusiasm at the head to the faltering rally of the right shoulder, every phase tells a story of weakening demand and growing distribution. When price breaks below the neckline on strong volume, the story turns decisively bearish. Traders who learn to read this pattern with precision—validating it with volume, confirming the breakout, and managing risk appropriately—can use it to anticipate significant trend changes. While it shouldn’t be used in isolation, its combination of visual clarity and psychological insight makes it a cornerstone of technical analysis. Whether trading stocks, forex, or commodities, mastering the Head and Shoulders Top can sharpen your timing and improve your overall market edge.
What exactly does a Head and Shoulders Top formation indicate in technical analysis?
A Head and Shoulders Top formation indicates a reversal of an upward trend to a downward (bearish) trend. It signals that buying pressure is exhausted and selling pressure is taking over, leading to a likely decline in price.
How reliable is the Head and Shoulders Top pattern as a predictor of trend reversal?
It is considered one of the most reliable and significant trend reversal patterns in technical analysis. However, its reliability is enhanced when confirmed by other indicators and strong volume characteristics. No pattern is 100% accurate, and false signals can occur.
What are the key components of a Head and Shoulders Top pattern, and how do they form?
- Left Shoulder: A price peak during an uptrend, followed by a correction.
- Head: A higher price peak after the left shoulder’s correction, followed by a deeper correction.
- Right Shoulder: A lower price peak after the head’s correction, similar in height to the left shoulder, followed by a decline.
- Neckline: A line connecting the two troughs between the shoulders and the head.
These components form as market sentiment shifts from strong buying to weakening buying and increasing selling pressure.
Is the Head and Shoulders Top pattern always bearish, or can it indicate a bullish trend?
The Head and Shoulders Top pattern is always bearish, indicating a reversal from an uptrend to a downtrend. Its inverse, the Inverse Head and Shoulders pattern, is bullish, indicating a reversal from a downtrend to an uptrend.
What is the difference between a Head and Shoulders Top and an Inverse Head and Shoulders pattern?
The Head and Shoulders Top pattern forms at the peak of an uptrend with three peaks (middle highest) and signals a bearish reversal. The Inverse Head and Shoulders pattern forms at the bottom of a downtrend with three troughs (middle lowest) and signals a bullish reversal. They are mirror images of each other in terms of formation and implication.
How do traders typically set stop-loss orders and price targets when trading a Head and Shoulders Top pattern?
Traders typically place stop-loss orders just above the high of the right shoulder or just above the neckline. Price targets are calculated by measuring the vertical distance from the head’s peak to the neckline and projecting that distance downwards from the neckline breakdown point.
What role does trading volume play in confirming a Head and Shoulders Top formation?
Volume plays a crucial confirmatory role. Typically, volume is high on the left shoulder, moderate on the head, and noticeably lower on the right shoulder. A significant increase in volume as the price breaks below the neckline strongly confirms the bearish reversal.
Are there any common mistakes traders make when identifying or trading the Head and Shoulders Top pattern?
Yes, common mistakes include premature entry before neckline breakdown, ignoring volume confirmation, misidentifying the neckline, and not confirming the breakdown with a sustained close below the neckline. Proper patience and adherence to identification criteria are key.
Can the Head and Shoulders Top pattern be used effectively across all financial markets and timeframes?
While generally applicable, its effectiveness can vary. It is commonly used in stocks, forex, and commodities. The pattern tends to be more reliable on longer timeframes (e.g., daily, weekly charts) compared to very short intraday charts, where false signals are more frequent.
What other technical indicators should be used in conjunction with the Head and Shoulders Top pattern for confirmation?
Traders often use momentum oscillators like the Relative Strength Index (RSI) or MACD to confirm weakening momentum during the right shoulder’s formation. Moving averages can also provide additional confirmation of trend change upon breakdown. Combining indicators helps to increase the probability of a successful trade.
留言