

Introduction: Understanding August’s Reputation in Stock Market History
As summer winds down, financial markets often enter a period shrouded in cautious anticipation. August, in particular, carries a complex legacy—one that blends statistical trends with psychological undercurrents and real-world disruptions. Commonly referred to as the “dog days of summer” in trading circles, this month has long been associated with thinner trading activity, erratic price swings, and a subtle but persistent sense of uncertainty among investors. While not every August brings turmoil, the collective memory of past downturns, combined with recurring seasonal patterns, has cemented its reputation as a potentially treacherous stretch for equities. The idea of market seasonality—where certain times of the year tend to favor gains or losses—gains renewed attention when August rolls around. This article delves into the historical performance of the stock market during this month, unpacks the forces driving its often-unpredictable behavior, examines pivotal events that shaped its legacy, and offers practical guidance for investors navigating this seasonally sensitive window. By analyzing decades of data and the behavioral nuances at play, we aim to move beyond myth and deliver a clear, evidence-based understanding of why August continues to command such scrutiny.
A Historical Overview: August Stock Market Performance Data

To separate pattern from perception, a rigorous look at historical market data is essential. August’s standing in the financial calendar isn’t based on anecdote alone—it’s supported by measurable trends across major U.S. indices. While it’s not a month of guaranteed losses, the numbers consistently suggest a more challenging environment than others.
Decades of Data: Average Returns and Volatility in August
Long-term analysis of the S&P 500 reveals a recurring theme: August tends to deliver lower-than-average returns. When compared to the full-year performance, the month often lags, frequently placing near the bottom in terms of average monthly gains. While some years see modest advances, others bring flat or negative results, contributing to an overall picture of muted momentum. The Dow Jones Industrial Average echoes this trend, showing similar tendencies toward subdued performance. More telling, however, is the increase in volatility. With fewer market participants actively trading, price movements can become exaggerated, leading to sharper intraday swings and heightened unpredictability. The Nasdaq Composite, home to many high-growth technology firms, may experience even greater fluctuations, as these stocks are often more sensitive to shifts in investor sentiment during uncertain periods. According to research highlighted by Hartford Funds, historical data consistently ranks August among the weaker months for equity returns, especially when contrasted with the robust performances typically seen in November, December, and April.
August by the Numbers: Notable Positive and Negative Years
Despite the general pattern, August has produced some of the market’s most dramatic reversals—both upward and downward. These outliers serve as powerful reminders that while seasonality matters, it is never destiny. In August 1982, for instance, the S&P 500 surged more than 10%, marking the beginning of one of the longest and strongest bull markets in modern history. This turnaround was fueled by falling inflation and the Federal Reserve’s pivot toward lower interest rates, catching many bearish investors off guard. Fast forward to August 1998, and the picture was starkly different: the collapse of Long-Term Capital Management and Russia’s sovereign debt default triggered a global flight to safety, with the S&P 500 shedding nearly 15% from its July peak. Similarly, August 2007 saw early signs of the subprime mortgage crisis erupt into full-blown market stress, as credit markets seized and equities declined sharply. The following decade brought another turbulent August in 2011, when Standard & Poor’s downgrade of the U.S. credit rating and escalating fears over the Eurozone debt crisis sent markets tumbling. Yet, just nine years later, August 2020 defied expectations entirely. Amid the chaos of the pandemic, the S&P 500 not only recovered but reached new record highs, driven by unprecedented fiscal stimulus and a surge in technology stocks benefiting from remote work trends. These examples underscore a crucial point: macroeconomic shifts, policy decisions, and global events can override seasonal patterns at any time.
Comparing August: How It Stacks Up Against Other Months
When viewed within the full 12-month cycle, August’s performance stands in stark contrast to historically strong months. April and December, for example, have consistently delivered above-average returns. April often benefits from the release of strong first-quarter earnings and a post-tax season boost in investor confidence. December, meanwhile, is buoyed by seasonal optimism, holiday spending, and the “Santa Claus rally,” a late-year surge often attributed to portfolio window-dressing and year-end investment flows. In contrast, August often serves as a quiet, unsettled prelude to September—the single weakest month in the historical record for U.S. equities. This proximity to a statistically poor performer adds to August’s reputation, creating a psychological drag that can influence investor behavior. While correlation does not equal causation, the fact that weak Augusts are often followed by weak Septembers suggests a broader seasonal headwind that investors would be wise to acknowledge.
Why August? Unpacking the Drivers Behind Seasonal Market Trends
The question of why August behaves the way it does goes beyond raw numbers. A combination of structural, psychological, and behavioral factors helps explain the month’s unique market dynamics.
The “Summer Slump”: Low Trading Volume and Market Liquidity
One of the most tangible reasons for August’s volatility is the seasonal decline in market participation. As institutional investors, fund managers, and retail traders take summer vacations, trading volumes tend to drop significantly. This reduction in activity leads to lower liquidity—meaning fewer buyers and sellers are available at any given time. In such an environment, even modest trades can have an outsized impact on prices. A single large sell order, for example, may find few buyers, causing a stock to drop sharply. This amplification effect increases overall market volatility and can create a sense of fragility. Moreover, reduced liquidity makes it harder for large institutions to enter or exit positions without moving the market, which often leads to a more conservative approach. The result is a market that feels more reactive and less stable than during busier trading periods.
The Shadow of September: August as a Precursor to the Worst Month
August’s reputation is also shaped by its position on the calendar. It immediately precedes September, which holds the dubious distinction of being the worst-performing month for the stock market over the long term. This “September Effect” is a well-documented anomaly, with historical data showing the S&P 500 averaging negative returns in September more often than in any other month. Some analysts believe that August’s weakness is partly a psychological spillover—a time when investors begin to de-risk or lock in profits ahead of the traditionally volatile autumn. This preemptive caution can manifest as reduced buying activity or increased selling pressure, contributing to August’s underperformance. While the exact cause of the September Effect remains debated—ranging from corporate fiscal calendar resets to portfolio rebalancing—the anticipation of it can be enough to influence behavior in August, reinforcing the seasonal trend.
Sector-Specific Sensitivity: Why Big Tech Often Faces Headwinds
While broad market weakness can occur in August, certain sectors are more vulnerable than others. Technology stocks, particularly the large-cap giants that dominate the Nasdaq, often face increased pressure. These high-beta stocks—known for their volatility and growth potential—tend to attract speculative interest during strong markets but are also prime candidates for profit-taking when sentiment sours. With few major earnings reports typically released in August, there’s less positive news to support valuations, leaving tech stocks more exposed to negative headlines or macroeconomic concerns. Additionally, the “sell in May and go away” adage, though not universally followed, often extends into the summer months, with investors rotating out of high-growth names and into more defensive positions. This shift can weigh heavily on tech-heavy indices, amplifying the broader market’s seasonal softness.
Behavioral Economics: The “Panic Season” and Psychological Factors
Human psychology plays a significant role in shaping August’s market character. As summer vacations come to an end, investors return to work with a renewed focus on economic data, corporate guidance, and geopolitical risks on the horizon. This transition from leisure to labor can create a more risk-averse mindset. Behavioral economists suggest that this shift in mood—combined with the anticipation of fall earnings seasons and policy decisions—can foster a more cautious or even pessimistic outlook. Some researchers have even drawn parallels to historical agricultural cycles, where the late summer was a time of harvest and preparation for winter, subtly embedding a sense of urgency and scarcity into collective financial behavior. While speculative, the idea of a “panic season” suggests that investor psychology, influenced by both personal and societal rhythms, can amplify market volatility during this period. In low-liquidity environments, such sentiment can lead to herd behavior, where small moves trigger larger sell-offs.
Significant August Market Events: Beyond the Averages
While long-term averages provide context, the true story of August is written in its most dramatic moments—periods of profound crisis and unexpected resurgence.
Key August Crashes and Corrections: A Historical Timeline
August has repeatedly served as the backdrop for pivotal market events. In 1931, during the depths of the Great Depression, global financial confidence collapsed, and U.S. markets plunged amid banking instability. A similar downturn struck in 1937, when a brief recovery from the Depression stalled, leading to a sharp market correction in August. The 1971 “Nixon Shock,” when President Richard Nixon ended the dollar’s convertibility to gold and imposed wage and price controls, introduced significant uncertainty, resulting in a volatile and uncertain market environment. In 1990, Iraq’s invasion of Kuwait sent oil prices soaring and triggered a global equity sell-off as fears of war and recession mounted. The early tremors of the 2007 financial crisis also emerged in August, as liquidity dried up in credit markets and subprime mortgage losses began to surface. Then, in 2011, a perfect storm of U.S. debt ceiling tensions, a sovereign downgrade, and the European debt crisis led to one of the most volatile Augusts on record. These events demonstrate how the month can act as a catalyst for broader financial shifts, often amplifying existing vulnerabilities.
Unexpected August Rallies and Bullish Surprises
Yet, August is not solely defined by decline. It has also been the birthplace of major bull markets and powerful rallies. The 1982 surge, as previously noted, marked a generational turning point, ending a prolonged bear market and launching a decade-long expansion. In 1984, the market rebounded strongly in August on the back of improving economic data. The mid-1990s saw another positive stretch, with August 1995 contributing to a broader tech-driven rally. Even in 2000, amid the bursting of the dot-com bubble, a temporary rally in tech stocks provided a brief reprieve. In 2009, August was part of the early recovery from the financial crisis, as stimulus measures began to take hold and investor confidence slowly returned. Most strikingly, August 2020 witnessed the S&P 500 and Nasdaq reach new highs despite a global pandemic, powered by massive monetary support and the dominance of stay-at-home technology stocks. These episodes highlight that while seasonal trends offer guidance, they are far from infallible.
Navigating August: Strategies and Outlook for Investors
Understanding August’s historical patterns doesn’t mean succumbing to seasonal fear. Instead, it provides a framework for making more informed and resilient investment decisions.
Considering Seasonality in Investment Decisions
Market seasonality should be viewed as one input among many—not a standalone strategy. Recognizing that August has historically been a period of lower returns and higher volatility allows investors to adjust their expectations and risk tolerance accordingly. This might involve reviewing portfolio allocations, rebalancing toward more stable assets, or preparing for increased short-term swings. However, it’s critical to remember that every year is different. Economic conditions, monetary policy, and geopolitical developments often outweigh seasonal influences. A disciplined, long-term approach—built on diversification, consistent contributions, and clear financial goals—remains the most effective way to weather any market environment, seasonal or otherwise.
Focusing on Fundamentals and Robust Risk Management
In times of uncertainty, a return to basics is essential. Investors should prioritize companies with strong balance sheets, sustainable earnings, and durable competitive advantages. These fundamentals matter more than the calendar. Diversification—across asset classes, sectors, and geographies—remains a cornerstone of risk reduction. Equally important is the implementation of sound risk management practices. This includes setting stop-loss levels, maintaining adequate cash reserves, and avoiding emotional reactions to short-term volatility. Sticking to a well-defined investment plan, especially when seasonal narratives amplify anxiety, is one of the most effective ways to avoid costly mistakes.
Opportunities in Volatility: Sector-Specific and Value Considerations
While August may test investor resolve, it can also present strategic opportunities. Defensive sectors—such as utilities, consumer staples, and healthcare—often demonstrate greater resilience during market pullbacks, making them attractive holdings during uncertain periods. Moreover, any significant market dip in August could offer a chance to acquire high-quality stocks at more reasonable valuations. Value investors, in particular, may find this environment appealing, as short-term sentiment can drive strong companies’ prices below their intrinsic worth. The key is having the discipline to identify fundamentally sound businesses and the patience to hold them through temporary turbulence. For those with a longer horizon, volatility isn’t just a risk—it’s a potential entry point.
Conclusion: What August’s History Teaches Us About Market Dynamics
August’s place in market history is both cautionary and instructive. The data consistently shows a tendency toward lower returns and higher volatility, shaped by thin trading, seasonal psychology, and the looming shadow of September. Yet, the month has also hosted some of the market’s most powerful rallies, proving that history never repeats in exactly the same way. The interplay of statistical trends, macroeconomic forces, and human behavior makes August a microcosm of the broader market—unpredictable, emotional, but ultimately driven by fundamentals. The real lesson isn’t to fear August, but to respect it. By maintaining a balanced portfolio, focusing on long-term goals, and avoiding reactionary decisions, investors can navigate its challenges with confidence. Seasonal patterns offer insight, but discipline, diversification, and perspective remain the true anchors in any market climate.
Frequently Asked Questions About August Stock Market History
1. Is August historically a good month for the stock market?
Historically, August has generally been a weaker month for the stock market, often exhibiting lower average returns and increased volatility compared to the annual average. It tends to rank among the poorer performing months, though not universally negative.
2. How has the stock market performed in August over the past decade?
Performance over the past decade has been mixed. While some years saw declines or flat performance, others, like August 2020, experienced strong rallies driven by specific economic conditions or technological trends. It reinforces the idea that while a tendency exists, each year’s outcome is influenced by unique factors.
3. What are the main reasons for August’s typical stock market volatility?
Key reasons include:
- **Low Trading Volume:** Many institutional and retail investors are on vacation, leading to reduced market participation and lower liquidity.
- **Amplified Movements:** Lower liquidity means smaller trades can have a larger impact on prices, increasing volatility.
- **Precursor to September:** Anticipation of the historically weak September can lead to profit-taking or increased caution.
- **Behavioral Factors:** End-of-summer sentiment and psychological shifts can contribute to investor anxiety.
4. Do “Big Tech” stocks specifically underperform in August, and if so, why?
Big Tech and growth stocks can be particularly sensitive in August. They are often subject to profit-taking after strong runs, as investors may rotate into more defensive sectors during periods of perceived market weakness or heightened caution. Reduced fresh news flow and higher valuations can also make them more vulnerable.
5. What is the “September Effect” and how does August’s performance relate to it?
The “September Effect” refers to the historical tendency for stock markets to perform poorly in September, making it statistically the weakest month of the year. August’s performance is often linked to this, with some theories suggesting that its weakness is partly a psychological or preparatory effect, as investors de-risk ahead of the traditionally challenging September.
6. Are there any major stock market crashes or significant events that historically occurred in August?
Yes, August has seen several significant market events, including:
- The onset of the Gulf War in August 1990.
- Early tremors of the 2007 financial crisis.
- The US credit rating downgrade and Eurozone debt crisis concerns in August 2011.
Conversely, August 1982 marked the start of a major bull market, and August 2020 saw new market highs.
7. What investment strategies should investors consider when approaching August’s market conditions?
Investors should consider:
- **Exercising Caution:** Be prepared for potential volatility.
- **Focusing on Fundamentals:** Prioritize strong companies.
- **Diversification:** Spread investments across different assets and sectors.
- **Risk Management:** Implement strategies like stop-loss orders.
- **Seeking Opportunities:** Volatility can create buying opportunities in defensive or undervalued stocks.
8. Is there a difference in August performance between different market sectors or market capitalization sizes?
Yes, August performance can vary. Growth sectors like technology may be more susceptible to profit-taking, while defensive sectors (e.g., utilities, consumer staples) might show more resilience. Smaller-cap stocks, which often have lower liquidity, can sometimes experience greater volatility than large-cap stocks during periods of reduced trading volume.
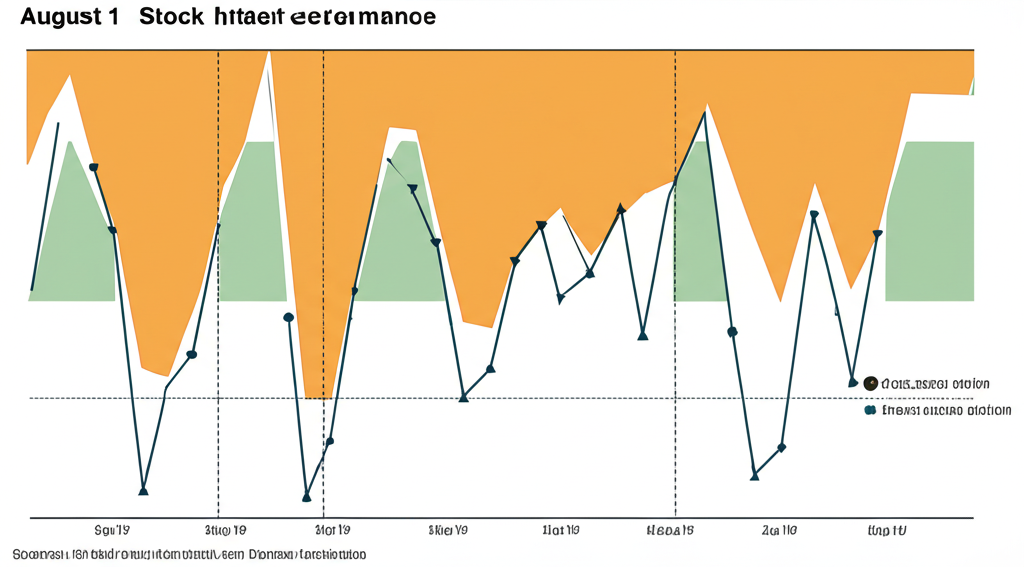
9. What historical data or charts can best illustrate August’s stock market trends and patterns?
Charts showing the S&P 500’s average monthly returns over several decades, or comparisons of August’s performance against other months, are highly illustrative. Timelines highlighting specific August market events (both positive and negative) also provide valuable context.
10. Does August’s stock market performance accurately predict the market’s direction for the rest of the year?
While August’s performance is often linked to the historically weaker September, it is not a definitive predictor for the rest of the year. Market performance is influenced by a multitude of factors, and while seasonal tendencies offer insights, they should be weighed against broader economic indicators, corporate earnings, and geopolitical developments.
留言