

Introduction: What is an AMC Squeeze Score and Why Does it Matter?

The idea of a short squeeze has long fascinated market watchers, but it wasn’t until the rise of meme stocks—especially AMC Entertainment Holdings (NYSE:AMC)—that this phenomenon captured widespread public attention. While there’s no single, universally accepted “AMC Squeeze Score,” the term broadly refers to a synthesis of financial indicators and behavioral signals that together suggest the likelihood of a sharp, upward price movement. This surge typically occurs when short sellers, under mounting pressure from rising prices, rush to buy back shares to close their losing positions. For a stock like AMC, which has become emblematic of retail investor defiance and market volatility, understanding the forces behind this score isn’t just academic—it’s essential for navigating one of the market’s most unpredictable players.
This guide breaks down the mechanics and psychology behind AMC’s squeeze potential. We’ll go beyond surface-level metrics to examine the real drivers: from quantifiable data like short interest and borrow costs to the intangible but powerful influence of online communities. By exploring both historical context and current conditions, we aim to equip investors with a clearer, more nuanced lens for interpreting AMC’s ongoing market narrative. Whether you’re tracking for opportunity or simply trying to understand the chaos, this analysis offers a roadmap through the noise.
Deconstructing the Short Squeeze Score: Key Metrics Explained
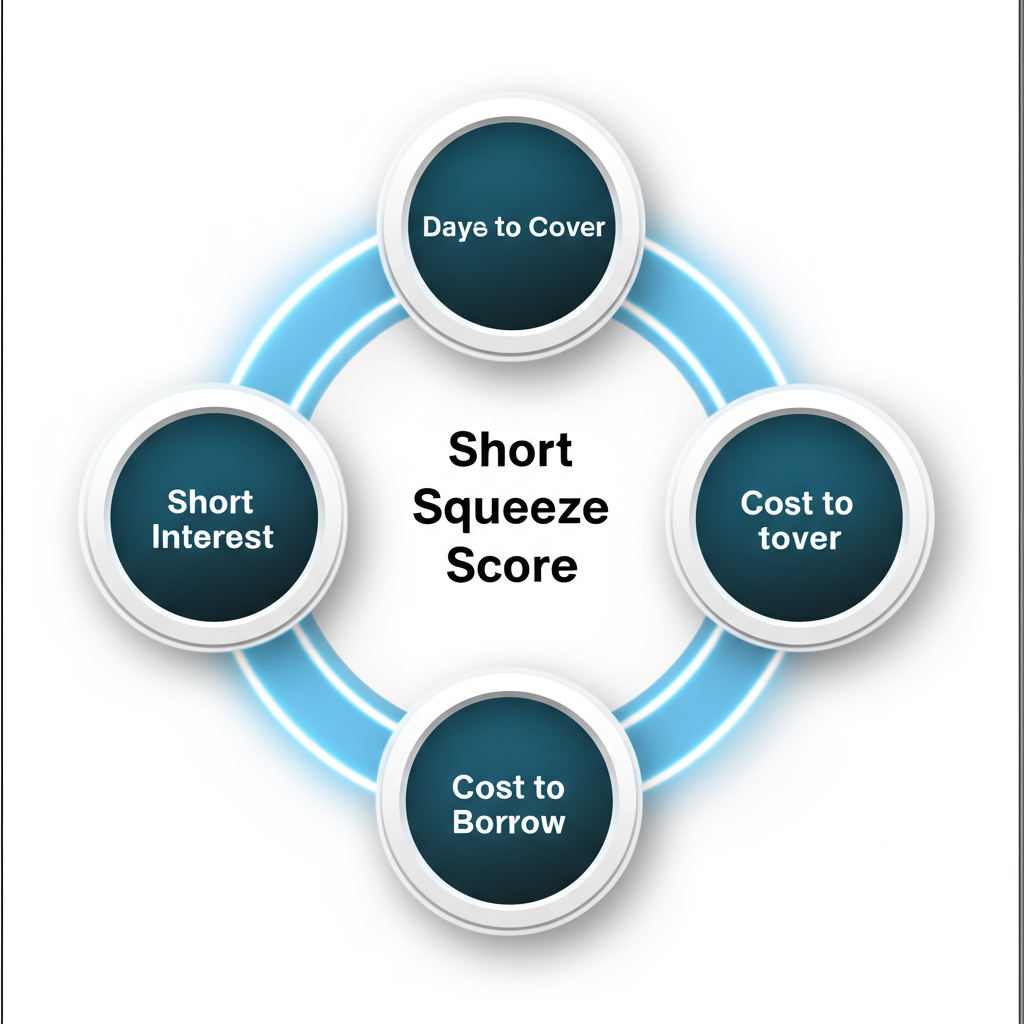
While the AMC squeeze score isn’t a standardized index, it functions as a conceptual framework built on several measurable financial indicators. Each of these components reveals a different facet of market tension, helping investors gauge how vulnerable short sellers are to a sudden reversal. Together, they form a composite picture of risk, opportunity, and potential market imbalance. Understanding these metrics isn’t just about reading numbers—it’s about decoding the battlefield where retail investors and institutional shorts are constantly at odds.
Short Interest Percentage & Shares Short
Short interest represents the total number of shares currently held in short positions—meaning investors have borrowed and sold them, betting the price will drop. When expressed as a percentage of the float (the number of shares available for public trading), it becomes a powerful signal of bearish sentiment. For example, if 20% of AMC’s float is shorted, nearly one in five tradable shares is effectively a bet against the company’s stock performance. Historically, a short interest above 10% is considered elevated; above 20% is seen as high-risk territory. With AMC, these figures have often soared past 30%, especially during periods of intense speculation, indicating a crowded short trade that could unravel quickly if momentum shifts.
Days to Cover (DTC)
Days to Cover (DTC) measures how long it would take short sellers to buy back all their positions at the current average trading volume. It’s calculated by dividing the total shares short by the average daily trading volume. A DTC of 3 to 5 days suggests moderate pressure—shorts could exit without drastically moving the market. But when DTC climbs to 7, 10, or even higher, it signals a potential tinderbox. In such cases, a surge in buying activity forces short sellers to compete for limited shares, often driving prices up in a self-reinforcing cycle. For AMC, high DTC has frequently coincided with explosive price moves, as short sellers scramble to cover amid rising panic.
Cost to Borrow / Borrow Rate
The cost to borrow reflects the annualized interest rate short sellers pay to borrow shares from brokers. This rate fluctuates based on supply and demand: when shares are hard to find, the cost spikes. For AMC, this metric has at times reached astronomical levels—exceeding 100% or even 500% during peak squeeze events. A high borrow rate isn’t just an expense; it’s a warning sign. It means shorting the stock is expensive and risky, increasing the likelihood that traders will close positions early to avoid mounting costs. This dynamic can act as a catalyst, especially if the stock begins to rise and the financial burden becomes unbearable.
Short Volume & Dark Pool Activity
Daily short volume shows how many shares are sold short on a given day, offering a real-time pulse of bearish sentiment. While short interest gives a snapshot of the total short position, short volume reveals ongoing activity. Consistently high short volume, particularly when the price is flat or declining, suggests persistent institutional pressure. Meanwhile, dark pool activity—trades executed off public exchanges—adds another layer of complexity. These transactions, often involving large institutional players, can obscure true market demand and are sometimes viewed by retail investors as mechanisms to suppress price movement. Monitoring both short volume and dark pool data helps paint a fuller picture of the hidden forces at play beneath the surface.
AMC’s Current Squeeze Score & Related Data (Today’s Snapshot)
Evaluating AMC’s current squeeze potential requires up-to-date, reliable data. While exact figures shift daily, the broader trends offer insight into whether the conditions are ripe for another volatility surge. As of recent reports, AMC continues to maintain a higher-than-average short interest, though not at the extreme levels seen in 2021. The key is not just the raw numbers, but how they interact with market sentiment and trading behavior.
Where to Find Up-to-Date AMC Short Data
To stay informed, investors should turn to specialized financial platforms that aggregate and analyze short interest metrics in real time. These tools provide the granularity needed to make informed decisions:
- Fintel.io: A go-to resource for detailed short interest data, Fintel delivers insights into short interest percentage, shares short, days to cover, and borrow rates. It’s frequently referenced in market discussions and offers a user-friendly interface for tracking AMC’s metrics. Access the dedicated page at Fintel’s AMC Short Squeeze page.
- Ortex: Known for its real-time analytics and institutional-grade data, Ortex provides deeper visibility into short utilization and borrowing demand. While a subscription is required for full access, many financial analysts cite Ortex when discussing squeeze potential.
- MarketBeat: Offers free, bi-weekly updates on short interest, making it accessible for casual investors. The site also includes additional fundamental and technical analysis tools. Check MarketBeat’s AMC page for regular updates.
- ShortSqueeze.com: Tailored specifically for identifying potential squeeze candidates, this platform tracks key indicators and ranks stocks based on their volatility and short interest.
Given that official short interest data is reported only twice a month by exchanges, relying on platforms that offer daily estimates and borrow rate trends is crucial for staying ahead of potential shifts.
Interpreting the Latest AMC Metrics
As of the most recent data, AMC’s short interest percentage has hovered between 15% and 25%—a level that, while not record-breaking, still represents significant bearish positioning. A DTC in the 3–5 day range suggests moderate pressure, but if volume spikes or short interest grows, that figure could climb quickly. Meanwhile, the cost to borrow has remained elevated in certain periods, occasionally surpassing 10%, indicating ongoing scarcity of lendable shares. These metrics, while not flashing red, suggest that the structural conditions for a squeeze remain present.
What sets AMC apart is not just the numbers, but the ecosystem around them. Even when quantitative indicators appear stable, the stock can ignite due to sudden surges in retail buying or social media momentum. The 2021 episode proved that metrics alone don’t tell the whole story—especially when a passionate investor base is ready to act.
The Legendary AMC Short Squeeze of 2021: A Historical Perspective
The 2021 AMC short squeeze wasn’t just a market event—it was a cultural moment. What started as a struggling movie theater chain, burdened by pandemic-related closures and heavy short positioning, transformed into a symbol of retail investor power. From a share price below $5, AMC rocketed to over $70 by June 2021 (pre-reverse split), fueled by a wave of coordinated buying that exposed vulnerabilities in the traditional hedge fund playbook.
This wasn’t a gradual recovery. It was a firestorm. As retail investors piled in, short sellers found themselves trapped. Every price increase forced more coverings, which in turn drove prices higher—a classic feedback loop. The result was catastrophic for some institutional investors and life-changing for others. More importantly, it redefined what was possible in modern markets, where sentiment and coordination could override fundamental analysis.
The Role of Retail Investors and Social Media (Reddit)
The engine behind the 2021 surge was the retail investor community, primarily organized through Reddit forums like r/wallstreetbets and r/amcstock. These digital hubs became more than discussion boards—they evolved into command centers for collective action. Members, often calling themselves “apes,” shared strategies, celebrated gains, and reinforced the ethos of “diamond hands”—refusing to sell no matter the volatility.
Reddit’s influence was transformative. It allowed thousands of small investors to act as a unified force, countering the institutional dominance that had long shaped market dynamics. The emotional energy, memes, and shared narratives kept morale high during price dips, ensuring that buying pressure didn’t fade. This social cohesion turned AMC from a speculative play into a movement, proving that decentralized investors could challenge even the most entrenched financial positions.
Key Indicators Leading Up to the 2021 Squeeze
In hindsight, several red flags signaled that AMC was primed for a squeeze:
- Extremely High Short Interest: At its peak, short interest exceeded 50% of the float, with some estimates suggesting over 100% due to complex shorting practices. This meant more shares were sold short than were freely available, creating a dangerous imbalance.
- Elevated Days to Cover: DTC stretched beyond 10 days, indicating that covering positions would be slow and painful, especially in a rising market.
- Low Share Price: Priced in single digits, AMC was accessible to retail investors, allowing them to accumulate large positions with relatively small capital outlays.
- Building Retail Momentum: Early signs of coordinated buying and growing online chatter provided a qualitative warning that institutional shorts may have overlooked.
Together, these factors created a perfect storm—one that few analysts predicted but that changed the course of market history.
Is AMC Still a Good Short Squeeze Candidate? Factors Beyond the Score
Even with fluctuating metrics, AMC remains a focal point for squeeze speculation. But assessing its potential today requires looking beyond spreadsheets and data points. The stock exists at the intersection of finance, psychology, and digital culture—a space where traditional models often fall short.
Market Sentiment & Investor Psychology
For AMC, sentiment is a driving force. The “apes” community remains active, holding firm in their belief that a “MOASS” (Mother of All Short Squeezes) could still happen. This psychological resilience—refusing to sell despite volatility—creates a floor of support that few other stocks enjoy. Unlike typical shorted equities, where price drops lead to capitulation, AMC often sees buying dips as opportunities. This behavior disrupts normal market mechanics, making it harder for shorts to predict or control outcomes.
Company Fundamentals vs. Squeeze Potential
AMC’s financial health has improved since 2021. The company has reduced debt, raised capital, and diversified its offerings beyond traditional movie screenings. However, for many retail investors, fundamentals take a backseat to the squeeze narrative. While stronger operations could support a sustainable rally, the current valuation is still heavily influenced by market structure and sentiment rather than earnings or revenue growth. This divergence means AMC can behave unpredictably—rising on social media hype rather than quarterly results.
Broader Market Conditions and Regulations
Macro factors also play a role. High interest rates increase the cost of maintaining short positions, potentially forcing exits. Economic uncertainty can amplify volatility, creating fertile ground for squeezes. Meanwhile, ongoing debates about short selling transparency, dark pool trading, and retail access could reshape the landscape. Any regulatory shift that limits institutional advantages or increases disclosure could further empower retail investors, reigniting squeeze potential.
Risks and Considerations for Short Squeeze Investing in AMC
While the potential for explosive gains is real, investing in AMC with the expectation of a squeeze carries substantial risks. This is not a passive play—it’s a high-stakes, high-volatility scenario that demands careful consideration.
Volatility and Price Swings
AMC is notorious for wild price swings. Gains of 20% in a single day can be followed by equally sharp declines. Investors must be prepared for emotional and financial turbulence. Those seeking stable returns or long-term growth may find AMC too unpredictable. The stock rewards conviction but punishes hesitation.
Potential for Dilution and Share Offerings
One of the most significant risks is dilution. To raise capital, AMC has issued new shares in the past—a move that strengthens the balance sheet but increases the total float. More shares outstanding make it harder to drive prices up through buying pressure, as the “short squeeze math” changes. Each offering resets the game, requiring even greater retail participation to achieve the same effect. Investors should monitor capital raises closely, as they can dampen momentum.
Conclusion: Navigating the Complexities of the AMC Squeeze Score
The AMC squeeze score isn’t a fixed number—it’s a living, evolving indicator shaped by data, sentiment, and market structure. While metrics like short interest, days to cover, and borrow rates provide a foundation, they don’t capture the full picture. AMC’s story is also about community, defiance, and the power of collective action in the digital age. The 2021 squeeze wasn’t just a financial anomaly; it was a demonstration of how retail investors, armed with information and unity, can disrupt established systems.
For anyone analyzing AMC today, a balanced approach is essential. Track the data, understand the context, and respect the risks. But also recognize that in this unique corner of the market, human behavior often outweighs traditional logic. The key is not to chase the next squeeze blindly, but to understand the forces that make it possible—and to act with clarity, not just conviction.
Frequently Asked Questions about AMC Squeeze Score
Is AMC still being shorted heavily, and what are the current short interest figures?
While the exact figures fluctuate daily, AMC often maintains a significant level of short interest, though typically not at the extreme peaks seen in early 2021. Investors can find current short interest percentage and shares short data on financial platforms like Fintel or MarketBeat, which are usually updated bi-weekly by exchanges.
What is considered a “good” short squeeze score, and how is it typically calculated by financial platforms?
There isn’t a universally “good” short squeeze score as it’s often a proprietary calculation by different platforms (e.g., Ortex, ShortSqueeze.com). Generally, a high score indicates a strong potential, driven by metrics such as:
- Very high short interest percentage (e.g., above 20-30% of float)
- High Days to Cover (e.g., 5-10+ days)
- Elevated Cost to Borrow (e.g., above 10-20% annualized)
- High utilization rate (indicating few shares available to short)
留言