Understanding the Core of Swing Trading
Welcome to the world of swing trading! As you navigate the exciting yet challenging financial markets, you’ll encounter various approaches to capitalize on price movements. Among these, swing trading stands out as a dynamic strategy that aims to capture profits over relatively short periods, typically ranging from a few days to a couple of weeks, and sometimes extending to a month or two. It’s a middle ground, positioned between the rapid, intraday movements targeted by day traders and the longer-term trends pursued by investors.
At its heart, swing trading is about identifying and riding the “swings” or temporary shifts in an asset’s price trend. Think of market prices not as straight lines, but as a wavy path. These waves move up and down within a larger trend or a defined range. A swing trader seeks to enter a trade at the beginning of an anticipated upswing (for a long position) or downswing (for a short position) and exit the position when that swing shows signs of reversing or losing momentum. We’re not trying to catch the absolute bottom or top of a move; instead, our goal is to capture a significant “chunk” of the expected price movement.
Why might you consider swing trading? Perhaps you find the intensity and constant monitoring required for day trading overwhelming, but you also don’t want to commit your capital for years like a long-term investor. Swing trading offers a balance. It demands less constant attention than day trading, allowing you to potentially manage positions alongside other commitments, yet provides more frequent trading opportunities than long-term strategies. It’s an active approach that requires skill, discipline, and a solid understanding of market mechanics.
This style relies heavily on technical analysis. We look at price charts, patterns, and indicators to forecast potential price movements and identify high-probability entry and exit points. While fundamental factors (like earnings reports or economic news) can sometimes act as catalysts for swings, the primary tool for the swing trader is the chart itself. We study historical price action to find clues about future possibilities.
Throughout this guide, we will explore the foundational concepts, key strategies, and essential risk management techniques that underpin successful swing trading. We’ll use real-world examples to illustrate how these principles are applied in practice, helping you build a structured approach to navigating market swings and potentially turning market volatility into profitable opportunities.
In summary, swing trading combines the benefits of both day trading and long-term investing, allowing traders to capitalize on shorter market movements while still maintaining flexibility in their trading schedules. Key points include:
- Targeting price movements over periods of days to weeks.
- Balancing time commitment and trading frequency.
- Utilizing technical analysis as a primary tool for decision-making.
Swing Trading vs. Other Styles: Time and Pace
To truly appreciate swing trading, it’s helpful to understand where it fits within the broader spectrum of trading and investing styles. The primary differentiator is the holding period – how long you typically keep a position open. This duration significantly impacts the analysis methods used, the types of risks encountered, and the time commitment required.
On one end of the spectrum is day trading. Day traders open and close all their positions within the same trading day. They never hold positions overnight. This style is characterized by its high frequency, rapid execution, and reliance on very short-term price fluctuations, often focusing on intraday momentum, volatility, and order flow. Day trading demands constant attention, quick decision-making, and sophisticated tools for fast execution. The analysis is often conducted on very short timeframes, like 1-minute or 5-minute charts.
On the other end is long-term investing. Long-term investors hold assets for months, years, or even decades. Their focus is typically on fundamental analysis – evaluating a company’s intrinsic value, growth prospects, dividends, and the overall economic landscape. While they may use technical analysis for entry points, the decision to hold is based on the long-term potential of the asset. This approach requires patience and the ability to ride out short-term market noise and volatility.
Swing trading sits comfortably in the middle. Our holding period is longer than a day trade, allowing us to avoid the intraday noise and capture larger price moves that develop over several days or weeks. We’re not tied to our screens every minute, but we do need to check charts and manage positions daily or at least several times a week. The analysis typically focuses on daily or 4-hour charts, identifying trends and patterns that unfold over these intermediate timeframes.
Here’s a simple comparison:
| Style | Holding Period | Analysis Style | Time Commitment | Risk |
|---|---|---|---|---|
| Day Trading | Minutes to hours | Intraday charts (1m, 5m, 15m) | High, constant monitoring | Intraday volatility, execution risk |
| Swing Trading | Days to weeks (sometimes months) | Daily, 4-hour charts | Moderate, daily checks needed | Overnight/weekend gaps, market corrections, trend reversals |
| Long-term Investing | Months to years | Weekly, Monthly charts, Fundamental Analysis | Low, periodic reviews | Long-term economic shifts, company performance, systemic risk |
Understanding these differences helps you determine if swing trading aligns with your personality, available time, and financial goals. It offers a compelling blend of activity and patience, seeking to profit from the natural ebb and flow of market prices over a manageable timeframe.
The Technical Arsenal: Charts and Indicators for Swing Traders
As we’ve established, technical analysis is the backbone of swing trading. We rely on historical price and volume data, presented graphically on charts, to identify patterns and predict potential future movements. Think of technical analysis as reading the market’s language, spoken through price action. What are the key tools in our arsenal?
First and foremost are the price charts themselves. Candlestick charts are particularly popular among traders because they visually represent the open, high, low, and closing prices for a specific period (like a day). This gives us a quick snapshot of the price action within that timeframe. By observing sequences of candlesticks, we can identify patterns that suggest potential trend continuation or reversal.
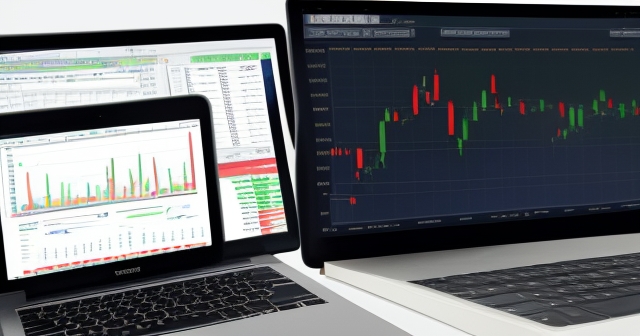
Within these charts, we constantly look for support and resistance levels. Support is a price level where buying interest is historically strong enough to stop a downtrend and potentially reverse it upwards. Resistance is a price level where selling interest is historically strong enough to halt an uptrend and potentially push the price downwards. These levels are like invisible floors and ceilings on the price chart, often serving as key areas for potential entries and exits. Identifying strong, tested support and resistance is fundamental to many swing trading strategies.
Trend lines are another vital tool. An uptrend line connects successive higher lows, while a downtrend line connects successive lower highs. These lines help us visualize the direction and slope of a trend. A break of a trend line can often signal a potential change in direction, offering swing trading opportunities.
Beyond these basic charting tools, swing traders extensively use technical indicators. These are mathematical calculations based on price and/or volume data, plotted on the chart or in separate panels below the price action. They help us confirm trends, measure momentum, identify overbought/oversold conditions, and spot potential reversals. Some essential indicators include:
- Moving Averages (MAs): These smooth out price data to create a single flowing line, making it easier to spot the trend direction. Common MAs are the 50-day, 100-day, and 200-day simple or exponential moving averages. Crossovers between different MAs (like the 50-day crossing above the 200-day, known as a “golden cross”) can generate buy or sell signals.
- Relative Strength Index (RSI): This momentum oscillator measures the speed and change of price movements. It oscillates between 0 and 100. Readings above 70 are often considered overbought, suggesting a potential pullback or reversal, while readings below 30 are considered oversold, suggesting a potential bounce. Divergence between price and RSI can also be a powerful reversal signal.
- Moving Average Convergence Divergence (MACD): This trend-following momentum indicator shows the relationship between two moving averages of a security’s price. It consists of the MACD line, the signal line, and a histogram. Crossovers of the MACD line and the signal line, or divergence from the price, can signal potential changes in momentum and trend.
- Bollinger Bands: Developed by John Bollinger, these bands consist of a middle band (typically a 20-period simple moving average) and two outer bands that are usually two standard deviations away from the middle band. They expand and contract based on market volatility. Price often tends to stay within the bands, and touches of the outer bands can indicate potential reversals or continuations, depending on the context. A “squeeze” in the bands (when they narrow significantly) often forewarns of an impending period of increased volatility and a potential breakout.
- Donchian Channels: Created by Richard Donchian (associated with the “Turtle Trading” system), these channels are formed by plotting the highest high and lowest low over a specific period (e.g., 20 days). The upper band represents the highest price over the period, and the lower band represents the lowest price. Trading breakouts above the upper band or below the lower band is a core strategy.
- Keltner Channels: Similar to Bollinger Bands, but they use the Average True Range (ATR) to set the width of the bands around a moving average. They can also be used to identify breakouts and potential trend moves.
Choosing the right combination of tools depends on your specific strategy and the asset you are trading. The key is to become proficient in reading charts, interpreting indicators, and understanding how they can signal potential swing trading opportunities. It’s not about finding a single perfect indicator, but rather using multiple tools to confirm signals and increase the probability of a successful trade.
Mastering Momentum and Retracements: Classic Swing Strategies
Now that we have our technical tools ready, let’s delve into some of the most popular swing trading strategies. These approaches offer different ways to capitalize on market swings, based on whether you prefer trading with a strong trend or catching temporary pullbacks.
One of the most straightforward strategies is Momentum Trading. The idea here is simple: find assets that are moving strongly in one direction and jump aboard, riding the momentum until it shows signs of fading or reversing. We’re looking for stocks or ETFs that are experiencing significant price increases on rising volume, indicating strong buying pressure (or decreasing price on rising volume for short positions). Indicators like the Relative Strength Index (RSI) can help identify assets with strong momentum, although we must be mindful of overbought conditions which might signal an imminent pullback.
Consider an example often seen in strong bull markets. A stock like Walmart (WMT), while sometimes seen as slow-moving, can experience periods of strong upward momentum fueled by positive news or sector rotation. A momentum trader might enter a long position after identifying a clear upward trend on the daily chart, confirmed by a bullish crossover in moving averages and increasing volume. The trader would ride this wave until the price action becomes choppy, volume decreases on upward moves, or bearish candlestick patterns appear, signaling a potential loss of momentum.
Another fundamental strategy is the Retracement Strategy, often referred to as “buying the dip” in an uptrend or “selling the bounce” in a downtrend. Markets rarely move in a straight line. Even in a strong uptrend, prices will periodically pull back or “retrace” before continuing their move upwards. The retracement strategy aims to enter a long position when the price pulls back to a key support level or technical indicator during an established uptrend. Similarly, in a downtrend, a trader would look to enter a short position when the price bounces up to a resistance level.
Key levels for potential retracement entries include previously broken resistance levels (which can turn into support), moving averages (like the 20-day or 50-day MA acting as dynamic support), or Fibonacci retracement levels (commonly 38.2%, 50%, or 61.8% of the prior move). For instance, if Meta Platforms (META) is in a strong uptrend and experiences a pullback, a retracement trader might look for the price to find support around its 50-day moving average or the 50% Fibonacci retracement level of the latest swing high-to-low. An entry could be triggered if the price bounces off this level with a bullish candlestick pattern, confirming the support held.
These two strategies, Momentum and Retracement, often form the core of a swing trader’s playbook. Momentum trading capitalizes on existing strength, while retracement trading seeks entry at potentially lower-risk points after a temporary correction. Both require a clear understanding of trend direction and careful observation of price action at key levels.
Breakouts and Ranges: Trading Defined Price Action
Beyond riding existing trends or buying dips, swing traders can also profit from shifts in market dynamics, specifically breakouts from consolidation patterns or movements within defined price ranges.
The Breakout Strategy is about trading when price moves decisively out of a predefined range or pattern. This range could be a period of horizontal consolidation (a “rectangle” or “box”), a triangle formation (ascending, descending, or symmetrical), or simply breaking above a key resistance level or below a key support level that has held for some time. Breakouts often signal the beginning of a new directional move, fueled by increasing conviction from buyers or sellers.
A famous example of a breakout strategy is the Turtle Strategy, popularized by Richard Dennis. This system often uses Donchian Channels, entering a long position when the price breaks above the N-day high (e.g., 20-day high) and a short position when it breaks below the N-day low. The logic is that a breakout from a recent range indicates strong momentum is building in the direction of the breakout.

Imagine a stock like Visa (V) trading sideways in a narrow range for several weeks. The price repeatedly hits a ceiling of $250 and a floor of $240. A breakout trader would place buy orders just above $250 and potentially short-sell orders just below $240. If the price then surges above $250 on high volume, it triggers the long entry, anticipating a sustained move upwards as buyers overwhelm sellers at the resistance level.
Conversely, the Range Trading Strategy is employed when an asset’s price is oscillating predictably between clear support and resistance levels, without establishing a strong trend. In a range-bound market, the strategy is to buy near the support level and sell near the resistance level. This requires confirming that the support and resistance levels are holding and that price is indeed bouncing between them.
For instance, if an ETF like the Financial Select Sector SPDR Fund (XLF) is trading within a defined channel between $42 and $44 for an extended period, a range trader might look to buy XLF shares when the price dips near $42, placing a stop-loss order just below $42 and a profit target near $44. The trade would be exited near $44, potentially reversing the position to short-sell if there are signs of resistance holding, with a stop just above $44 and a target near $42.
Range trading is often considered more challenging than trend following because it requires anticipating reversals at the boundaries of the range. Breakout trading, on the other hand, aims to capture the start of a new trend, but carries the risk of “false breakouts” where price briefly moves outside the range before snapping back. Both strategies require careful observation of price action and volume to confirm signals.
Specialized Setups: Squeezes, Catalysts, and Reversals
Beyond the core strategies, experienced swing traders employ more specialized setups that capitalize on specific market conditions or anticipated events. These often require a deeper understanding of technical nuances and market psychology.
The Squeeze Setup identifies periods of low volatility that are likely to precede a significant price move. When volatility contracts, technical indicators designed to measure volatility, such as Bollinger Bands or Keltner Channels, will narrow. A “Bollinger Band Squeeze” occurs when the bands become unusually narrow, suggesting that price is consolidating tightly before an explosive move. A squeeze setup trader looks to position themselves to profit from the direction of the impending breakout, which is often indicated by other technical factors like trend direction or candlestick patterns preceding the squeeze.
Imagine a stock like Tesla (TSLA), known for its volatility, experiencing a period of unusually tight price consolidation, causing its Bollinger Bands to constrict significantly. This “squeeze” tells us that energy is building for a large move. While the squeeze itself doesn’t tell us the direction, observing the price action leading into and within the squeeze – perhaps higher lows forming – could suggest an eventual bullish breakout. A trader might enter a long position upon a decisive break above the upper Bollinger Band on high volume, anticipating a rapid upward move as volatility expands.
The Catalyst Anticipation Strategy involves taking a position in anticipation of a specific, scheduled event that is expected to significantly impact the asset’s price. The most common catalysts are earnings reports. Companies announce their quarterly earnings on specific dates, and these announcements often lead to large price gaps or rapid directional moves, regardless of the overall market trend. Other catalysts could include FDA approvals for pharmaceutical companies, major contract wins, or regulatory decisions.
Trading around catalysts is risky due to the uncertainty of the event’s outcome and market reaction. However, savvy swing traders might position themselves based on pre-event sentiment, historical stock reaction to earnings, or technical patterns forming before the announcement. For example, if Alphabet (GOOGL) is set to report earnings, and the stock has been consolidating bullishly into the event, a trader might take a small position beforehand, anticipating a positive reaction, while using options to manage the significant gap risk that earnings can cause. This requires careful risk sizing, as a negative surprise can lead to substantial losses.
Finally, the Reversal Trading Strategy is perhaps the most challenging but potentially rewarding approach. It involves identifying the end of an existing trend and entering a position in the opposite direction. This is like trying to catch a falling knife or shorting a rocket, and it requires strong confirmation signals to avoid trading against a still-powerful trend.
Traders using reversal strategies look for signs of trend exhaustion. These include bearish divergence on momentum indicators like the RSI in an uptrend (price makes higher highs, but RSI makes lower highs), significant bearish candlestick patterns at resistance levels (like an evening star or engulfing pattern), or a decisive break below a key support level after a sustained uptrend. For instance, if Palantir (PLTR) has had a parabolic rise and starts showing clear bearish divergence on the RSI, coupled with a break below a short-term trend line and a bearish candlestick pattern, a reversal trader might consider initiating a short position, anticipating a significant pullback or trend change.
Mastering these specialized setups requires patience to wait for the right conditions and the ability to interpret multiple technical signals concurrently. They add layers of sophistication to your swing trading playbook.
Putting It Together: Real-World Swing Trading Examples
Theory is essential, but seeing strategies applied to actual market movements brings them to life. Let’s walk through a few hypothetical examples based on the concepts we’ve discussed, illustrating how swing traders identify, enter, manage, and exit positions.
Example 1: Momentum Trade in GE Vernova (GEV) Post-Spin-off
Imagine observing GE Vernova (GEV) shortly after its spin-off, as it starts to establish its independent trading history. You notice a clear, strong upward trend forming on the daily chart. The price is consistently trading above its rising 20-day and 50-day moving averages. The Relative Strength Index (RSI) is trending upwards, holding above 50, indicating bullish momentum. Volume is increasing on upward moves, suggesting strong buying conviction.
This looks like a promising momentum setup. You decide to enter a long position as price breaks above a recent consolidation high, confirming the continuation of the upward move. Your entry point is based on this breakout. You place a stop-loss order below the low of the breakout candle or below the nearest significant support level (perhaps the 20-day MA), limiting your potential loss if the trend reverses. Your profit target might be based on Fibonacci extensions from the prior swing or a measured move based on the height of the consolidation range.
As the trade progresses, you monitor the price action daily. If the stock continues to trend upwards strongly, you might consider trailing your stop-loss upwards to lock in profits. However, if you see signs of momentum slowing – perhaps bearish divergence appearing on the RSI, or a large bearish candlestick forming – you might decide to sell into strength near your target or when these warning signs appear, rather than waiting to be stopped out. Exiting while the price is still high, even if it hasn’t hit your full target, helps preserve gains and reduces the risk of a sharp reversal wiping out profits.
Example 2: Retracement Trade in an ETF like XLF During a Pullback
Suppose the overall market, represented by indices like the S&P 500, is in a strong uptrend. The Financial Select Sector SPDR Fund (XLF), which tracks financial stocks, has also been trending upwards but experiences a temporary pullback as part of the market’s natural rhythm. You observe that XLF is pulling back towards its rising 50-day moving average, a level that has historically acted as support.
This presents a potential retracement trade opportunity. You wait for the price action at the 50-day MA. You see a couple of smaller-bodied candles followed by a strong bullish engulfing candle, indicating that buyers are stepping in at this support level. This confirms the potential bounce.
You enter a long position near the close of the bullish confirmation candle. Your stop-loss is placed just below the 50-day MA and the low of the recent pullback. Your profit target is set near the previous swing high or a resistance level identified on the chart. You manage the trade by monitoring if the price resumes its upward trajectory. If it stalls or shows weakness as it approaches the previous high, you might take partial profits or tighten your stop-loss.
Example 3: Breakout Trade from a Range in Dutch Bros (DUOL)
Let’s consider Dutch Bros (DUOL) trading in a tight, horizontal range for several weeks. This consolidation forms clear support and resistance levels. You’ve drawn a horizontal resistance line across the recent highs and a support line across the recent lows. Price has bounced between these levels multiple times.
You anticipate a potential breakout. You set an alert or a buy stop order just above the resistance level. One day, the price surges upwards, breaking decisively above the resistance on higher-than-average volume. This triggers your long entry.
Your stop-loss is positioned just below the broken resistance level (which now acts as potential support). Your profit target could be a measured move equal to the height of the prior trading range, projected upwards from the breakout point, or based on the next significant resistance level on the weekly chart. You monitor the trade, ensuring the broken resistance holds as support on any subsequent pullbacks. If the breakout falters and price drops back into the range, your stop-loss protects you from significant loss on a false breakout.
These examples illustrate how different strategies leverage technical signals to identify opportunities and manage risk. While specific outcomes are never guaranteed, applying these structured approaches enhances your probability of success in capturing market swings.
Navigating Market Corrections and Volatility
Markets are rarely calm. They experience periods of strong trends, but also corrections, consolidations, and heightened volatility. A skilled swing trader understands that these different market environments require adjustments to strategy and risk management.
During a broad market correction, where major indices like the S&P 500 or Nasdaq 100 are pulling back significantly, most stocks will also decline. Trying to swing trade purely bullish setups becomes much harder, and the probability of being stopped out increases. However, corrections don’t mean the end of swing trading opportunities; they simply shift where we look and what strategies we might employ.
In a correction, we might look for assets that show relative strength. These are stocks or sectors that are holding up better than the overall market – perhaps declining less, consolidating horizontally, or even starting to trend upwards while the broader market is still falling or struggling. Identifying relative strength often involves comparing the performance of an individual stock or ETF (like XLY, the Consumer Discretionary ETF, or specific gold stocks represented by GDX) against the performance of a major index. A strong relative strength line on a chart can highlight these potential opportunities.
Strategies that might work well in a correction include:
- Trading Retracements in Relatively Strong Assets: If a stock shows relative strength by only pulling back slightly during a market dip, waiting for it to bounce off support (like a key moving average or prior high) can offer a lower-risk entry into a potential leader once the market stabilizes.
- Shorting Opportunities: While we’ve focused on long examples, corrections present clear opportunities for short-selling. Identifying weak stocks that are breaking down through support levels can be a profitable strategy.
- Trading Defensive Sectors: During uncertainty, capital may flow into defensive sectors like utilities or consumer staples, which can offer trending or range-bound opportunities against the broader market decline.
Volatility is another factor we must constantly assess. High volatility means prices are moving rapidly and with large swings. This can be exciting for potential profits but also increases the risk of stop-losses being triggered prematurely or unexpected large price gaps. During periods of extreme volatility, you might consider reducing your position size, widening your stop-losses slightly (if your strategy allows), or focusing only on the clearest, highest-conviction setups.
Low volatility, conversely, can lead to choppy, directionless price action. This is where the Squeeze Setup becomes relevant, as it specifically targets the period of low volatility *before* a potential breakout. Trading range-bound strategies might also be more effective during low volatility periods when clear channels form.
Understanding the current market context – whether it’s trending strongly, correcting, or range-bound, and whether volatility is high or low – is crucial for selecting the most appropriate strategy and adjusting your risk parameters. It’s not just about finding a setup on an individual chart; it’s about understanding that setup within the larger market narrative.
Essential Risk Management for Swing Success
We cannot overstate the importance of risk management in swing trading. While strategies help us find opportunities and potential profits, risk management is what protects our capital and ensures we can continue trading after inevitable losing trades. Without proper risk control, even a profitable strategy can lead to ruin due to a few large losses. Think of it as the safety net beneath the high-wire act of trading.
The cornerstone of swing trading risk management is the stop-loss order. This is an order placed with your broker to automatically sell a security when it reaches a certain price. It defines the maximum amount you are willing to lose on any single trade. Before you even enter a trade, you must know exactly where your stop-loss will be placed. This is typically below a key support level for a long position, or above a key resistance level for a short position.
Coupled with the stop-loss is the concept of the risk/reward ratio. This ratio compares the potential profit you aim to achieve on a trade to the potential loss you are risking (the distance between your entry price and your stop-loss). A favorable risk/reward ratio means your potential profit is significantly larger than your potential loss – perhaps 2:1, 3:1, or even higher. If you risk $1 to potentially make $3, you can afford to lose more often than you win and still be profitable overall. We should generally avoid trades where the potential reward is smaller than the risk (e.g., 1:1 or less), as these require a very high winning percentage just to break even.
Position sizing is another critical element. This determines how many shares or units of an asset you will trade. The size of your position should be directly linked to your stop-loss and the amount of capital you are willing to risk on that specific trade. A common rule is to risk only a small percentage of your total trading capital on any single trade, often 1% to 2%. For example, if you have a $50,000 trading account and risk 1% per trade, your maximum loss per trade is $500. If your stop-loss is $5 away from your entry price, you would buy or short-sell 100 shares ($500 risk / $5 per share risk = 100 shares).
Why is position sizing so important? It protects you from significant drawdowns. Even if you have several losing trades in a row, risking only a small percentage keeps your overall capital largely intact, allowing you to continue trading and recover losses. Risking too much on a single trade (e.g., 10% or 20%) means a few losses can quickly wipe out a large portion of your account.
Swing traders also face specific risks, notably overnight and weekend gap risk. Prices can move significantly between the market close and the next open, especially if major news breaks while the market is closed. Your stop-loss order might be triggered at a price worse than your specified stop price (a “gap through”), resulting in a larger-than-expected loss. While this risk cannot be entirely eliminated, being aware of upcoming news events, reducing position size before known catalysts, or using options strategies can help manage it. We also need to be mindful of potential gaps over weekends.
Effective risk management isn’t just about setting a stop-loss; it’s about integrating stop-losses, risk/reward ratios, and position sizing into every single trading decision. It’s your insurance policy in the markets.
Executing Your Trades and Taking Profits
Identifying a potential swing trade setup is just the first step. Executing the trade properly and managing it through to a profitable exit are equally vital. This involves understanding different order types and having a plan for taking profits.
When entering a swing trade, you might use different order types:
- Market Order: Executes immediately at the best available price. Useful when you want to get into a trade quickly, but the execution price can vary slightly, especially in volatile markets.
- Limit Order: Executes only at a specified price or better. Useful if you want to enter a trade at a specific level, but there’s no guarantee your order will be filled if the price doesn’t reach that level.
- Stop Order (Buy Stop or Sell Stop): Becomes a market order when the specified stop price is reached. Useful for breakout strategies – a buy stop is placed above current price to enter a long trade on a break higher, and a sell stop is placed below current price to enter a short trade on a break lower.
Your entry strategy should dictate the order type. For a retracement trade, you might use a limit order to buy at a specific support level. For a breakout trade, a buy stop order is appropriate.
Once in a trade, management is key. This primarily involves monitoring price action relative to your stop-loss and your target. As a profitable trade moves in your favor, you can employ techniques to protect your gains.
One powerful tactic is selling into strength. Instead of waiting for the price to hit your ultimate profit target or waiting for a reversal signal, you might choose to sell a portion of your position (e.g., half) as the stock experiences a strong upward move. This locks in some profit immediately, reduces your risk exposure on the remaining position, and allows you to potentially hold the rest for further gains without the same level of emotional pressure. This is particularly useful in volatile markets or when trading near significant resistance levels.
Another approach is to use trailing stop-losses. Instead of a fixed stop-loss price, a trailing stop adjusts upwards as the price moves higher (for a long position). For example, a trailing stop might be set a fixed percentage below the current price, or based on a technical indicator like a short-term moving average. This allows you to ride a strong trend while ensuring that if the price reverses significantly, you are stopped out with a profit.
Your profit-taking strategy should be defined in your trading plan. Will you use a fixed price target? Will you use a trailing stop? Will you take partial profits along the way? Having a clear plan prevents emotional decisions from dictating your exits.
Successful execution and profit taking come from discipline – sticking to your predefined plan, using appropriate order types, and managing the trade actively but without over-interference based on short-term noise. It’s a balance between giving the trade room to breathe and knowing when to protect your capital and profits.
Building Your Swing Trading Plan and Choosing a Platform
Consistent success in swing trading isn’t just about knowing strategies; it’s about having a structured framework for your trading activities. This comes in the form of a comprehensive trading plan. A trading plan is essentially your personal rulebook. It outlines your goals, risk tolerance, preferred strategies, entry and exit criteria, position sizing rules, and how you will review your performance. Having a written plan helps you stay disciplined, avoid impulsive decisions, and provides a basis for evaluating what works and what doesn’t.
What should go into your trading plan?
- Goals: What do you hope to achieve? (e.g., consistent monthly returns, learning specific strategies).
- Risk Tolerance: How much capital are you willing to risk in total, and per trade?
- Assets to Trade: Which stocks, ETFs, or other instruments will you focus on? (e.g., S&P 500 components, tech ETFs, sector-specific funds).
- Preferred Timeframes: What charts will you use for analysis (e.g., Daily, 4-hour)?
- Strategies: Which specific swing trading strategies will you employ (e.g., retracement, breakout)? How will you identify setups for each?
- Entry Rules: What specific conditions must be met to enter a long or short trade? (e.g., price bounces off 50-day MA, bullish candlestick confirmation).
- Exit Rules: Where will you place your initial stop-loss? How will you determine your profit target? Will you use trailing stops or take partial profits? When will you exit a losing trade?
- Position Sizing: What percentage of your capital will you risk per trade? How will you calculate your position size based on your stop-loss?
- Market Conditions: How will you adjust your approach during different market phases (trending, range-bound, correction)?
- Review Process: How often will you review your trades and plan? (e.g., weekly, monthly). Keeping a trading journal is invaluable for learning.
Developing and sticking to your trading plan is a form of discipline that separates consistent traders from those who struggle.
Another crucial practical step is choosing the right trading platform and brokerage. Your platform is your interface with the market – where you view charts, perform analysis, place orders, and manage positions. What should you look for?
- Reliability: The platform must be stable and reliable, especially during volatile market periods.
- Charting Tools: Does it offer advanced charting capabilities, all the indicators you need, and the ability to draw trend lines, support/resistance, etc.?
- Order Execution: How fast and reliable is order execution? Are spreads competitive?
- Available Instruments: Does the platform offer the assets you want to trade (stocks, ETFs, options, CFDs, forex)?
- Regulation & Security: Is the brokerage well-regulated in reputable jurisdictions? How is your capital protected?
- Fees & Commissions: What are the costs associated with trading (commissions, spreads, inactivity fees)?
- Customer Support: Is support readily available if you encounter issues?
If you’re considering diving into forex trading or exploring a wide range of CFD instruments alongside stocks and ETFs, then choosing a platform that offers flexibility and choice is key. You need access to robust tools across different asset classes.
If you’re considering starting forex trading or exploring more CFD instruments, then Moneta Markets is a platform worth considering. Originating from Australia, it offers over 1000 financial instruments, suitable for both beginners and professional traders.
In choosing a trading platform, the flexibility and technical advantages of Moneta Markets are noteworthy. It supports popular platforms like MT4, MT5, and Pro Trader, combining high-speed execution with low spread settings for a good trading experience.
Developing a solid trading plan and selecting a platform that meets your needs are foundational steps. They provide the structure and tools necessary to implement your swing trading strategies effectively and consistently.
The Journey Ahead: Continuous Learning in Swing Trading
Swing trading, like any skill, requires continuous learning and refinement. The market is constantly evolving, presenting new challenges and opportunities. What works well in a strong bull market might need significant adjustment during a correction or a period of high volatility. Embracing a mindset of ongoing education is key to long-term success.
One of the best ways to learn is through practice, and paper trading (or demo trading) is an invaluable tool for this. Most brokers offer paper trading accounts that allow you to trade with virtual money in a simulated market environment. This lets you practice identifying setups, executing trades, applying your risk management rules, and testing your trading plan without risking real capital. It’s a safe space to make mistakes and learn from them.
Maintaining a trading journal is another critical practice. For each trade you take (both winners and losers), record the setup, your entry and exit prices, your stop-loss placement, the reason for the trade, the outcome, and your thoughts and emotions during the trade. Regularly reviewing your journal helps you identify patterns in your performance – which setups work best for you, common mistakes you make, and areas where you need to improve. It turns your trading experience into actionable data.
Learn from others, but develop your own style. There are countless books, articles, courses, and webinars on swing trading. Absorb knowledge from experienced traders, but be critical and adapt concepts to fit your own personality and risk tolerance. Not every strategy or indicator works for everyone. Experiment and find what resonates with you and fits your specific trading plan.
Stay informed about the market, but don’t get overwhelmed by noise. While swing trading is primarily technical, being aware of major economic news, earnings reports, and geopolitical events is important, as these can act as catalysts that disrupt technical patterns or create new opportunities. However, avoid getting bogged down in every single news headline or pundit’s opinion; focus on how major events might impact the technical picture and your planned trades.
Finally, remember that emotional control is paramount. Fear and greed are powerful forces that can derail even the best trading plan. Stick to your rules, especially regarding stop-losses and position sizing. Don’t chase trades you missed, and don’t let a winning trade turn into a loser because you got greedy. Discipline and patience are your greatest allies.
Swing trading offers a compelling path to actively participate in the financial markets, capitalizing on those intermediate-term price swings. By building a strong foundation in technical analysis, mastering diverse strategies, prioritizing rigorous risk management, and committing to continuous learning, you can develop the skills and discipline needed to navigate the market’s waves and work towards consistent profitability.
Whether you are taking your first steps or seeking to refine your existing approach, remember that the journey of becoming a proficient swing trader is ongoing. Embrace the learning process, stay disciplined, and focus on executing your plan with precision. We wish you the best in your trading endeavors!
swing trading examplesFAQ
Q:What is swing trading?
A:Swing trading is a trading style that seeks to capture price movements over short periods, typically days to weeks, by identifying and leveraging the “swings” in an asset’s price trend.
Q:How is swing trading different from day trading?
A:Swing trading involves holding positions for several days or weeks, whereas day trading requires opening and closing all positions within the same trading day.
Q:What tools do swing traders use?
A:Swing traders primarily use technical analysis tools such as price charts, trend lines, support and resistance levels, and various indicators like RSI, MACD, and moving averages to make informed trading decisions.
留言