
Welcome, aspiring traders and technical analysis enthusiasts! Today, we embark on a journey into the fascinating world of chart patterns, specifically focusing on one of the most reliable continuation patterns: the **Flag Pattern**. Imagine navigating the financial markets like sailing the open seas. Sometimes, the winds are strong and consistent, pushing you forward rapidly. But even the strongest winds require moments of calm, a brief pause before the momentum resumes. In technical analysis, the Flag Pattern often represents such a moment – a brief consolidation that signals the market is likely to continue its prior trend.
We’ll explore the anatomy of this powerful pattern, understand its different forms, and crucially, learn how you can interpret and potentially trade it effectively. Whether you’re a newcomer just grasping the basics or an experienced trader looking to refine your strategies, understanding flag patterns is an essential tool in your technical analysis toolkit.
Here are some key points about the Flag Pattern:
- Flag Patterns are continuation signals that indicate the market may resume its previous trend.
- They consist of a sharp price movement (flagpole) followed by a period of consolidation (flag).
- Recognizing these patterns can provide high-probability trading opportunities.

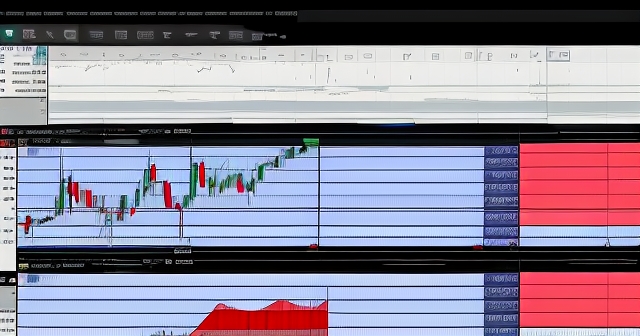
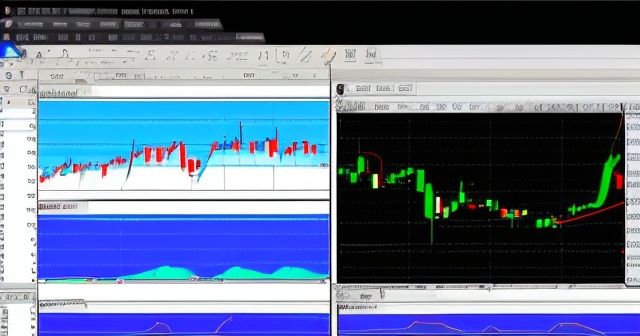
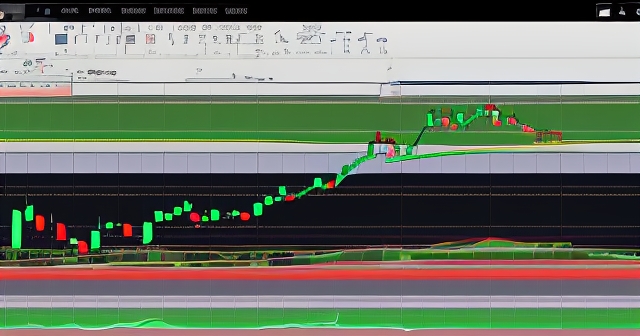
At its core, a **Flag Pattern** is classified as a continuation pattern. This means that when you identify a valid flag pattern on a price chart, it suggests that the prevailing trend is not ending, but merely taking a temporary break. Think of it as the market pausing to catch its breath before continuing the established direction. It appears after a significant, sharp price move, forming a small, contained consolidation area that looks remarkably like a flag on a pole.
Why do these patterns form? They represent a period where buyers (in an uptrend) or sellers (in a downtrend) momentarily take a pause after a strong move. Some traders might be taking profits, while others are waiting for confirmation before joining the trend. This creates a brief equilibrium, leading to the consolidation phase, before the dominant force regains control and pushes the price further in the original direction.
For you as a trader, recognizing a flag pattern can offer high-probability trading opportunities. It signals a potential entry point where the market’s momentum is likely to reignite, allowing you to join the continuation of the established trend. However, like all technical tools, they require careful identification and validation. We need to understand exactly what constitutes a flag pattern before we can trust its signals.
Understanding the Flag Pattern: A Technical Analysis Essential
Every flag pattern consists of two primary components, each critical to its definition and interpretation. Understanding these parts is like understanding the building blocks of a house; you need to know each piece and its role to see the whole structure clearly.
| Component | Description |
|---|---|
| Flagpole | This is the initial, strong, nearly vertical price movement that precedes the flag itself. It represents the powerful surge in buying (for a bull flag) or selling (for a bear flag) that established the short-term trend. |
| Flag | This is the subsequent consolidation area that forms as the price action oscillates within a relatively tight range after the flagpole’s rapid ascent or descent. |
Imagine planting a flag deeply into the ground after a challenging climb up a steep slope. The steep slope is your flagpole, the brief moment you pause to secure the flag and catch your breath is the flag itself. The stronger the initial climb (flagpole), the more significant the pause and subsequent continuation might be.
Distinguishing Flag Types: Bullish Flags vs. Bearish Flags
While the basic structure remains consistent, flag patterns manifest in two forms, directly correlating with the preceding trend:
-
Bull Flag: This pattern occurs during an uptrend. The flagpole is a strong, rapid upward price move. The flag itself is a downward-sloping or sideways consolidation channel, contained by two parallel trendlines. A bull flag signals that after this brief pause in buying, the price is likely to break out to the upside, continuing the preceding uptrend.
-
Bear Flag: Conversely, this pattern appears during a downtrend. The flagpole is a sharp, rapid downward price move. The flag is an upward-sloping or sideways consolidation channel, again defined by parallel trendlines. A bear flag suggests that after a brief interruption in selling pressure, the price is likely to break out to the downside, resuming the preceding downtrend.
Recognizing whether you are looking at a bull flag or a bear flag is straightforward: simply observe the direction of the preceding flagpole. This tells you the dominant trend the pattern is expected to continue.
Variations on the Theme: Pennants, Wedges, and High & Tight Flags
While the classic flag pattern features parallel consolidation lines, the market’s price action isn’t always perfectly uniform. This gives rise to variations that are closely related to flags and also signal continuation. The key difference often lies in the shape of the consolidation area:
-
Pennant: A pennant pattern is very similar to a flag pattern, sharing the critical flagpole component. However, instead of a parallel consolidation channel, the consolidation forms a symmetrical triangle or wedge shape, bounded by two converging trendlines. Like flags, pennants also represent a temporary pause before the prior trend resumes.
-
Wedge Flag (or Wedge Pattern as Continuation): Sometimes the consolidation area is not parallel or symmetrically converging, but instead forms a contracting wedge shape that slopes against the prevailing trend.
-
High and Tight Flag: This is a particularly potent bullish pattern, characterized by an extremely sharp and large flagpole followed by a very short and tight consolidation (the flag) that lasts no more than a few weeks and has minimal price retracement.
While these variations exist, remember the core principle: a strong preceding move (flagpole) followed by a relatively small, short-term consolidation against the direction of the move. The precise shape of the consolidation helps us categorize it, but the underlying market psychology of a temporary pause before continuation is the consistent theme.
The Crucial Role of Volume in Flag Pattern Confirmation
Technical analysis isn’t just about looking at price shapes on a chart. Volume is the market’s fuel, the engine that drives price movements. For flag patterns, volume analysis is crucial for validating the pattern and increasing the probability of a successful trade.
Here’s the typical volume signature you want to see with a valid flag pattern:
-
Flagpole Phase: You should ideally see high and increasing volume during the formation of the flagpole. This confirms that the initial strong price move was backed by significant conviction and participation from traders.
-
Flag (Consolidation) Phase: During the consolidation period, volume should significantly decrease. This suggests that participation has waned as traders wait for the next move.
-
Breakout Phase: When the price breaks out of the flag consolidation pattern, you want to see a sharp and significant increase in volume.
Ignoring volume when trading flag patterns is like driving a car without checking the fuel gauge. You might start, but you won’t know if you have the power to reach your destination. Always confirm the pattern’s validity and the breakout’s conviction with supporting volume analysis.
Interpreting Flag Patterns: What the Consolidation Tells Us
The flag portion of the pattern, though seemingly just a pause, actually provides valuable insights into the market’s sentiment and the potential strength of the subsequent move. Paying close attention to its characteristics can help you differentiate between a high-probability setup and a less reliable one.
What should you look for when interpreting the flag itself?
-
Duration: Flag consolidations are typically short-lived, often lasting only a few days to a few weeks.
-
Retracement Depth: The flag should not retrace too deeply into the flagpole’s territory. A shallow retracement indicates that the buyers or sellers are still largely in control.
-
Parallelism and Cleanliness: The parallel trendlines defining the flag should be relatively clear. Choppy price action can make the pattern less reliable.
-
Slope: The slight slope against the preceding trend is characteristic.
By carefully observing these aspects of the flag’s consolidation phase, you gain a deeper understanding of the market dynamics at play and can better assess the potential validity and strength of the expected breakout.
Trading the Breakout: Entry Strategies for Flag Patterns
Identifying a flag pattern is only the first step. The critical action comes when the price breaks out of the consolidation. Here are a few common approaches you can consider for timing your entry:
-
Entry on Breakout Confirmation: Wait for confirmation that the breakout is genuine, which can involve waiting for a candle to close outside the flag’s boundaries.
-
Entry on Breakout Retest: Sometimes, after breaking out, the price will pull back to retest the broken trendline. Entering on this retest can offer a slightly better price.
-
Aggressive Entry on Breakout: More aggressive traders might place a buy stop order just above the upper trendline of a bull flag or a sell stop order just below the lower trendline of a bear flag.
Your chosen entry strategy should align with your trading style and risk tolerance. Regardless of the method, the trigger for initiating the trade is the clear violation of the flag’s boundary in the direction of the original flagpole.
Mastering Risk Management: Setting Stop-Loss Orders with Flag Patterns
Trading chart patterns, including flags, comes with inherent risks. Setting a strategic stop-loss order is your primary defense mechanism.
| Stop-Loss Placement | Description |
|---|---|
| Below the Flag (Bull Flag) | For a bull flag breakout, place stop-loss slightly below the lowest point of the flag consolidation. |
| Above the Flag (Bear Flag) | For a bear flag breakout, the stop-loss is typically placed slightly above the highest point of the flag consolidation. |
| Using the Breakout Candle | Some traders place the stop-loss just below the low of the breakout candle for a bull flag or just above the high of the breakout candle for a bear flag. |
Your stop-loss level defines your maximum potential loss on the trade. Never enter a trade based on a flag pattern without knowing exactly where your stop-loss will be placed.
Setting Profit Targets: Projecting the Flagpole’s Potential
Just as you define your risk with a stop-loss, you also need a plan for taking profits. Flag patterns offer a common and often effective method for estimating a potential price target based on the pattern’s structure.
-
Measure the Flagpole: Calculate the vertical distance from the beginning of the flagpole move to the high of the flagpole.
-
Project from the Breakout: Take the measured length of the flagpole and project it forward from the point where the price broke out of the flag consolidation.
The resulting price level is your potential price target. This technique provides a data-driven target based on the pattern’s inherent energy.
Managing trades and setting targets effectively requires precise execution, especially in fast-moving markets like Forex or indices.
In selecting a trading platform, Moneta Markets stands out with its flexibility and technical advantages.
Applying Flag Patterns Across Markets and Timeframes
One of the appealing aspects of flag patterns is their versatility. You can find them occurring across a wide range of financial instruments and on different timeframes, making them applicable to various trading styles.
-
Instruments: Flag patterns are commonly observed in:
- Stocks: Both individual stocks and stock indices frequently display flag patterns during strong trending periods.
- Forex: Currency pairs are well-known for their trending behavior, making flag patterns regular occurrences.
- Commodities: Markets such as Gold, Silver, Crude Oil often exhibit strong trends and subsequent flag consolidations.
-
Timeframes: The pattern’s principle applies across different timeframes:
- Day Trading: Intraday charts can show flag patterns, offering rapid, short-term trading opportunities.
- Swing Trading: End-of-day charts commonly form flag patterns that play out over days or weeks.
- Position Trading: Weekly or monthly charts can display longer-term flag patterns.
Regardless of the market or timeframe, the core principles remain consistent. Always use proper risk management parameters and analyze the flags effectively.
Common Pitfalls and Risks When Trading Flag Patterns
No technical pattern is foolproof, and flag patterns, while often reliable, come with potential pitfalls. Being aware of these risks allows you to trade them more cautiously.
-
False Breakouts: This is arguably the most common risk, where the price moves convincingly outside the flag boundary but then quickly reverses.
-
Subjectivity in Identification: Drawing the parallel trendlines can sometimes be subjective, which may lead to varying interpretations of the breakout level.
-
Failure to Form: Sometimes a potential flagpole appears, but it doesn’t develop into a clear flag pattern.
-
Ignoring Volume: Trading a flag pattern based purely on price shape without confirming volume signals increases the risk of failure.
To mitigate these risks, adhere to your trading plan: wait for confirmed breakouts, always use stop-loss orders, and consider other technical tools to strengthen your conviction.
Putting It All Together: A Comprehensive Approach to Flag Pattern Trading
Mastering the flag pattern requires a disciplined approach that integrates identification, validation, strategy, and risk management. Here’s a summary of the comprehensive approach we’ve discussed:
- Step 1: Identify the Flagpole.
- Step 2: Locate the Flag Consolidation.
- Step 3: Validate the Pattern Structure.
- Step 4: Analyze Volume.
- Step 5: Plan Your Trade.
- Step 6: Execute on Breakout.
- Step 7: Manage the Trade.
By integrating the flag pattern into your technical analysis with this comprehensive approach, you are better equipped to navigate the markets and pursue your trading goals.
flag candle patternFAQ
Q:What is a flag pattern in trading?
A:A flag pattern is a continuation pattern that signifies a brief consolidation after a strong price movement before the original trend resumes.
Q:How can I identify a flag pattern?
A:Look for a flagpole consisting of a sharp price movement followed by a consolidation area that resembles a flag.
Q:What volume characteristics should be present with flag patterns?
A:Ideal volume should be high during the flagpole, decrease during consolidation, and then spike during the breakout.
留言