

Introduction to the UK Producer Price Index (PPI)
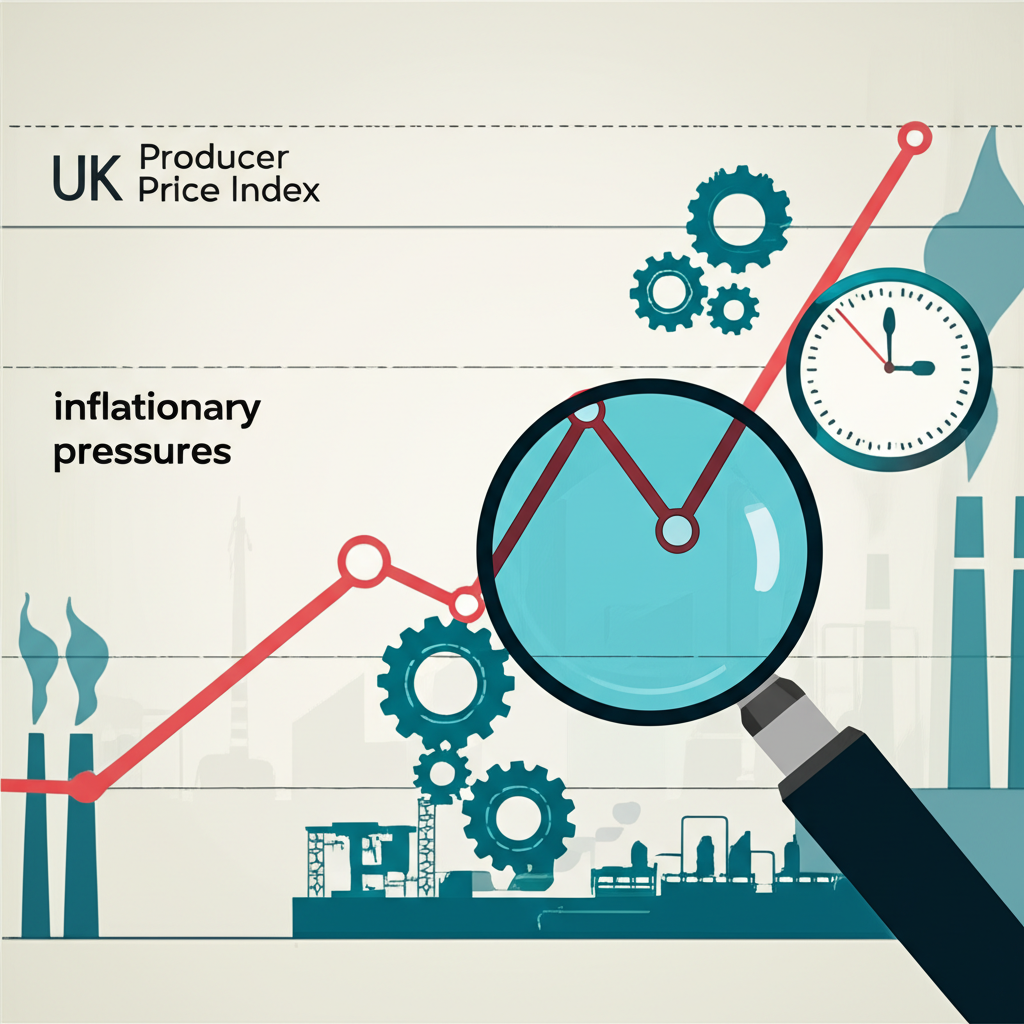
The UK Producer Price Index (PPI) stands as one of the most telling indicators of economic health, offering a clear lens into inflationary dynamics emerging from the manufacturing and production sectors. Rather than just another statistical figure, the PPI captures the shifting costs producers face when acquiring raw materials and the prices they secure when selling finished goods. These dual perspectives—input and output—make it a vital early signal for broader inflation trends, particularly those that eventually affect consumers. For economists, central bankers, investors, and business leaders, tracking the PPI is essential for anticipating shifts in pricing, supply chain stability, and monetary policy. Published monthly by the Office for National Statistics (ONS), this index delivers reliable, timely insights into the financial pressures shaping the UK’s industrial landscape.
Deconstructing the UK PPI: Input vs. Output Prices
The UK PPI is divided into two core components: Input PPI and Output PPI. Though related, each serves a distinct analytical purpose, shedding light on different stages of the production cycle and the underlying forces driving price changes.
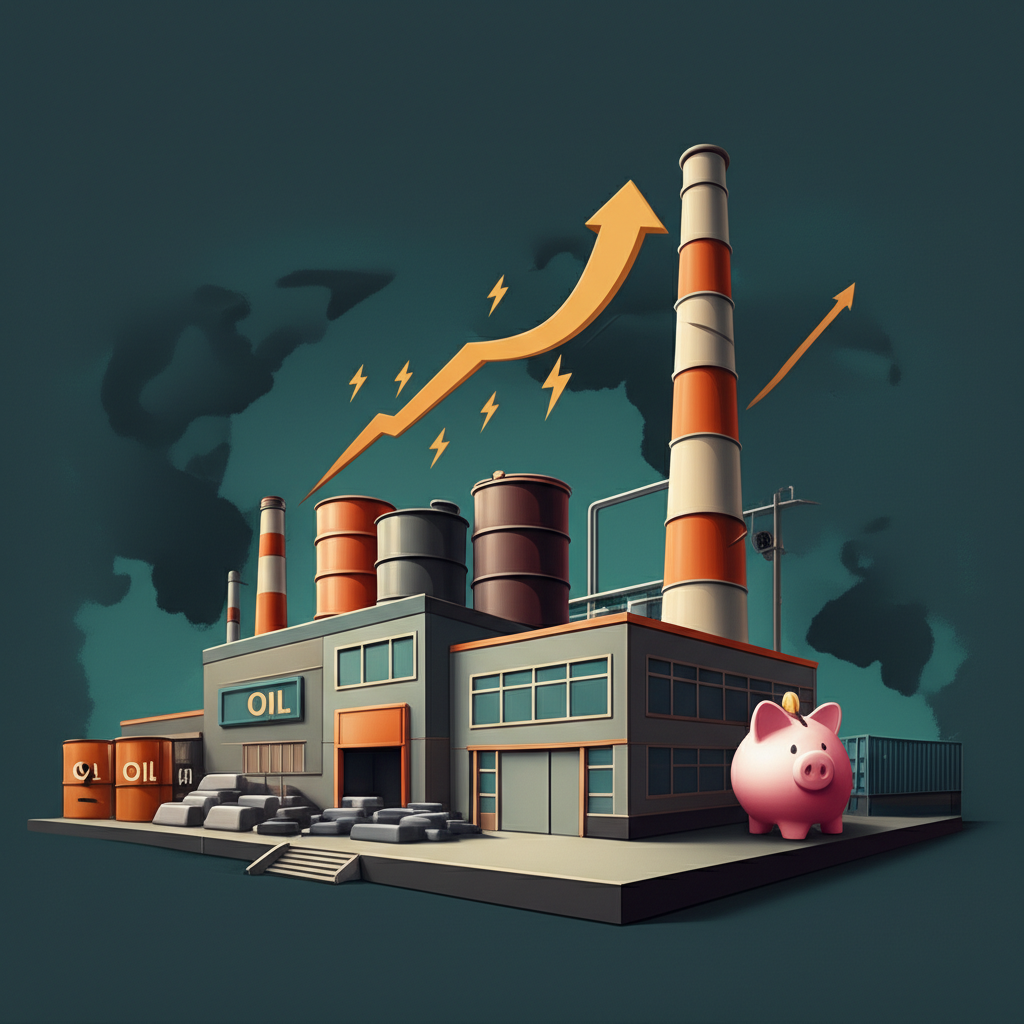
Input PPI: Measuring Costs for UK Producers
Input PPI reflects the average change in prices that UK manufacturers pay for the goods and services they need to produce their output. This includes raw materials like crude oil, metals, and agricultural products, as well as intermediate inputs such as components and energy. When Input PPI rises, it signals that production costs are increasing—often due to global commodity price swings, exchange rate fluctuations, or disruptions in supply chains. If businesses cannot pass these higher costs onto customers, profit margins may shrink. On the flip side, a declining Input PPI can ease financial pressure on firms, potentially leading to lower prices for consumers or improved earnings. Because it captures cost-push inflation at its origin, Input PPI is especially useful for identifying inflationary pressures before they ripple through the economy.
Output PPI: Tracking Prices at the Factory Gate
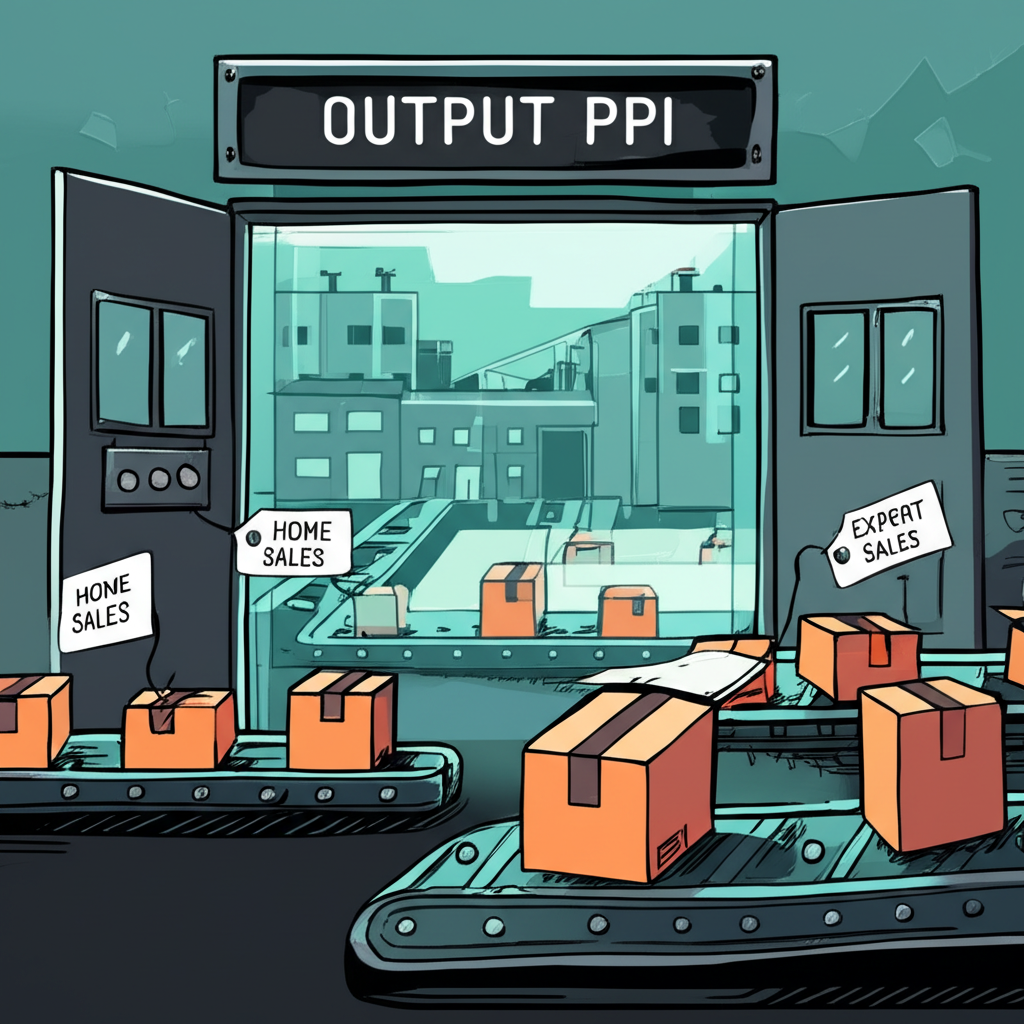
Output PPI measures the average change in prices received by UK producers for their finished goods at the point of sale—commonly referred to as “factory gate” prices. This component is often segmented into domestic sales (to UK buyers) and export sales (to international markets), allowing analysts to distinguish between local and global demand influences. A steady or rising Output PPI suggests producers have pricing power, whether due to strong demand or the need to offset higher input costs. As such, it acts as a direct barometer of inflation within the manufacturing sector and offers early clues about future movements in consumer prices. Because price increases at this stage often precede retail inflation, Output PPI is closely watched for signs of inflationary momentum.
Current UK PPI Data and Recent Trends

As of the most recent data release—representing October 2023—the UK’s Producer Price Index reveals a nuanced picture of inflationary cooling amid lingering pressures. Input PPI recorded a 0.5% decline month-on-month, a sign that immediate cost burdens on manufacturers are beginning to ease. This softening is largely attributed to stabilising energy markets and reduced global demand for certain commodities. However, the year-on-year figure remains positive at +2.8%, reflecting the cumulative impact of price surges experienced over the previous two years. On the output side, Output PPI rose by a modest 0.1% month-on-month, with a year-on-year increase of 1.5%. This suggests that while producers are still receiving higher prices than they did a year ago, the pace of price growth has slowed significantly. Analysts attribute this trend to a mix of moderating input costs, a relatively strong pound, and weakening domestic demand. When visualised over a 24-month timeline, the data shows a clear peak in late 2022 followed by a gradual descent, underscoring the transition from high inflation to a more stable pricing environment.
Historical Perspective: Key Milestones in UK PPI
The trajectory of the UK PPI over the decades mirrors the country’s economic evolution and its response to global shocks. During the oil crises of the 1970s and early 1980s, Input PPI spiked dramatically as energy prices soared, triggering widespread inflation and economic instability. A similar, though less severe, pattern emerged during the 2008 financial crisis, where PPI values initially surged due to currency depreciation and commodity volatility before collapsing as demand evaporated. More recently, the period from 2021 to 2022 marked one of the most intense inflationary episodes in modern history. Fueled by post-pandemic supply bottlenecks, soaring natural gas prices following the Ukraine conflict, and resilient consumer demand, Input PPI climbed to unprecedented levels—some months seeing annual growth exceeding 30%. Output PPI followed with a lag, as manufacturers adjusted prices to preserve margins. These historical peaks, clearly visible in long-term charts, serve as critical reference points for assessing current trends and evaluating whether today’s inflation is cyclical or indicative of deeper structural changes.
Methodology and Data Sources for UK PPI
The UK Producer Price Index is compiled and published by the Office for National Statistics (ONS), the UK’s principal authority on national economic data. The ONS gathers price information from a representative sample of manufacturing businesses across various industries, ensuring broad coverage of the industrial sector. The data collection process involves tracking prices for hundreds of specific goods and services, from steel and chemicals to food products and machinery. To construct the index, the ONS applies a weighted average methodology, where the importance of each product or input is determined by its share in total production or procurement costs. This weighting ensures the index accurately reflects the real-world experiences of UK producers. The ONS also revises its basket of goods and weights periodically to maintain relevance in a shifting economic landscape. With new data released each month, the PPI provides a timely and reliable snapshot of inflationary developments at the production level.
UK PPI vs. CPI: Understanding the Differences and Interplay
While both the Producer Price Index and the Consumer Price Index are key metrics for measuring inflation, they operate at different points in the economic chain and serve complementary roles.
Core Differences in Measurement and Scope
The fundamental distinction lies in perspective. PPI focuses on the producer’s side of the transaction—capturing the prices paid for inputs and received for outputs. It primarily covers goods at the wholesale or factory level, including raw materials, intermediate products, and finished goods before they reach retailers. In contrast, CPI measures the prices consumers actually pay for a predefined basket of goods and services, including food, housing, transportation, and healthcare. It reflects the final cost of living and incorporates retail markups, taxes, and service charges. As a result, CPI offers a direct view of household inflation, while PPI provides insight into the upstream pressures that may eventually influence those costs.
How PPI Can Signal Future CPI Movements
One of the most valuable aspects of the PPI is its role as a leading indicator for CPI. This relationship is often described through the “pipeline effect”—the idea that cost increases at the production level tend to flow downstream to consumers. For example, if the price of wheat rises significantly, this will first register in the Input PPI for food manufacturers. As bread producers face higher costs, they may raise their factory gate prices, pushing up the Output PPI. Eventually, this leads to higher retail prices for bread, which is then captured in the CPI. While not every input cost increase is fully passed on—due to competitive pressures or weak demand—sustained movements in PPI often foreshadow similar trends in consumer prices. Policymakers and forecasters rely on this lagged transmission to anticipate inflationary shifts before they become entrenched.
The Economic Significance of the UK PPI
Beyond being a statistical measure, the UK PPI plays a pivotal role in shaping economic decisions across both the public and private sectors.
Inflationary Pressures and Monetary Policy
The Bank of England’s Monetary Policy Committee (MPC) monitors PPI data closely when setting interest rates. A persistent rise in Input PPI, especially if followed by increases in Output PPI, signals that inflation is building within the supply chain. This can prompt the MPC to tighten monetary policy—raising interest rates to cool demand and prevent second-round effects, such as wage-price spirals. Conversely, a sustained decline in PPI may indicate disinflationary or even deflationary risks, potentially justifying a more accommodative stance to support growth. Given its forward-looking nature, PPI provides an early warning system that helps the central bank act proactively rather than reactively.
Impact on Business Costs and Profitability
For businesses, the PPI is more than an economic indicator—it’s a practical tool for strategic planning. A rising Input PPI means higher expenses for raw materials and energy, which can squeeze margins unless firms adjust pricing or improve efficiency. Some companies may absorb costs temporarily to retain market share, while others pass them on quickly, depending on their competitive position. Output PPI, meanwhile, reflects a firm’s pricing power. A strong Output PPI suggests robust demand and the ability to maintain profitability. Companies use PPI trends to guide procurement strategies, negotiate supplier contracts, and forecast cash flow. In industries with thin margins—such as food processing or textiles—even small shifts in input costs can have significant financial consequences.
UK PPI in a Global Context: Comparing with US PPI
Comparing the UK PPI with the US Producer Price Index reveals both common global trends and notable national differences. Both economies experienced sharp PPI increases during the 2021–2022 inflation surge, driven by supply chain disruptions and energy shocks. However, the magnitude and duration of these increases varied. The UK, with its greater reliance on imported natural gas, saw more pronounced energy-driven inflation in its Input PPI compared to the US, which has more domestic energy production. Additionally, the strength of the pound versus the dollar influenced import costs, with a weaker pound amplifying inflation in the UK. On the output side, US manufacturers sometimes demonstrated faster pricing adjustments, reflecting stronger domestic demand and different industrial structures. Analysts often refer to data from the U.S. Bureau of Labor Statistics (BLS) to benchmark these differences, highlighting how global forces interact with local economic conditions to shape inflation outcomes.
Future Outlook and Expert Forecasts for UK PPI
Looking ahead, most economic analysts expect the UK PPI to continue its gradual moderation, though short-term volatility remains likely. Year-on-year growth rates are projected to stabilise further as the base effects of previous price spikes drop out of the calculation. However, several risks could disrupt this trajectory. Global commodity markets—particularly oil, natural gas, and industrial metals—remain sensitive to geopolitical developments, including conflicts in the Middle East and trade policy shifts. Supply chain resilience continues to be a concern, especially for industries reliant on global just-in-time manufacturing. Domestically, the strength of consumer demand and ongoing wage pressures will influence whether producers can pass on remaining cost increases. A sustained recovery in business investment could also reignite demand for industrial inputs. While a return to 2022-level inflation is considered unlikely, institutions like the National Institute of Economic and Social Research (NIESR) caution that external shocks could still trigger renewed upward pressure on producer prices. Overall, the outlook suggests cautious optimism, with inflationary pressures easing but not yet fully resolved.
Conclusion: Navigating the UK’s Producer Price Landscape
The UK Producer Price Index is far more than a technical economic statistic—it is a vital diagnostic tool for understanding the pulse of the nation’s industrial economy. By tracking both the costs producers face and the prices they receive, the PPI offers a granular view of inflationary forces at their source. Its role as a leading indicator for consumer price trends makes it indispensable for policymakers, particularly in guiding monetary decisions that affect interest rates and economic stability. For businesses, the PPI informs critical choices around pricing, procurement, and risk management. Investors, too, rely on its signals to assess sector performance and market conditions. In an era marked by global uncertainty, supply chain fragility, and shifting energy markets, staying informed about the UK PPI—its current trends, historical patterns, and future trajectory—is essential for making sound economic decisions.
Frequently Asked Questions About the UK PPI Index
What does PPI stand for in the UK economy?
PPI stands for Producer Price Index. It is an economic indicator that measures the average change over time in the prices received by domestic producers for their output and the prices paid by them for their inputs.
How is the UK Producer Price Index calculated by the ONS?
The UK PPI is calculated by the Office for National Statistics (ONS) by collecting data on prices from a large sample of UK manufacturers. These prices are then weighted based on the relative importance of different products and sectors in total production or input costs to derive an overall index.
What are the key components of the UK PPI, and what do they signify?
The key components are Input PPI and Output PPI. Input PPI measures the change in prices for materials and fuels purchased by producers, signaling cost pressures. Output PPI measures the change in prices received by producers for their goods as they leave the factory gate, indicating inflationary pressures on final goods.
How does the UK PPI help predict future inflation trends?
The UK PPI is considered a leading indicator for consumer price inflation (CPI) due to the “pipeline effect.” Increases in producer prices (both input and output) often get passed on to consumers over time, signaling potential future rises in retail prices.
What are the current and most recent historical trends for the UK PPI?
Recent trends have shown a moderation in year-on-year growth for both Input and Output PPI after significant spikes in 2021-2022. Historically, the PPI has seen major fluctuations influenced by events like oil crises, global financial crises, and recent supply chain disruptions.
Where can I access official UK Producer Price Index data and bulletins?
Official UK PPI data and detailed bulletins are published monthly by the Office for National Statistics (ONS) on their website. You can find their latest releases and historical data there.
What are the main differences between the UK PPI and the UK CPI?
The UK PPI measures price changes from the perspective of producers (costs of inputs, prices of outputs), while the UK CPI measures price changes from the perspective of consumers (prices paid for a basket of goods and services by households).
How does the UK PPI compare to the US PPI in terms of recent performance?
While both indices have generally reflected global inflationary pressures, their specific trajectories can differ. These differences are often due to variations in economic structure, energy dependency, exchange rates, and national policy responses, leading to periods of divergence in their performance.
What are the implications of a rising or falling UK PPI for businesses and consumers?
For businesses, a rising PPI means higher costs (Input PPI) or increased revenue (Output PPI), impacting profit margins and pricing strategies. For consumers, a rising PPI can signal future increases in retail prices (CPI), reducing purchasing power. Conversely, a falling PPI can indicate easing costs for businesses and potentially lower consumer prices.
What is the “pipeline effect” regarding PPI and CPI?
The “pipeline effect” describes how changes in producer prices (PPI) tend to flow through the supply chain and eventually impact consumer prices (CPI). For instance, higher raw material costs captured by Input PPI can lead to higher factory-gate prices (Output PPI), which eventually translate into higher retail prices for consumers.
留言