
Introduction: Understanding the Global Economic Landscape

The global economy operates as a complex, interconnected system where nations continuously shape and respond to financial currents. Shifts in economic power influence trade flows, geopolitical strategies, and long-term market opportunities. For governments crafting policy, businesses expanding internationally, and individuals planning for the future, understanding these dynamics is essential. This article examines how we measure national economic strength, presents up-to-date rankings of the world’s largest economies, and explores projections for 2025, 2026, and beyond to 2050. We’ll also analyze the forces driving growth and decline, and offer a unique comparison between the economic output of major U.S. states and entire countries—revealing surprising parallels in scale and influence.
How We Measure Economic Might: GDP Nominal vs. GDP PPP
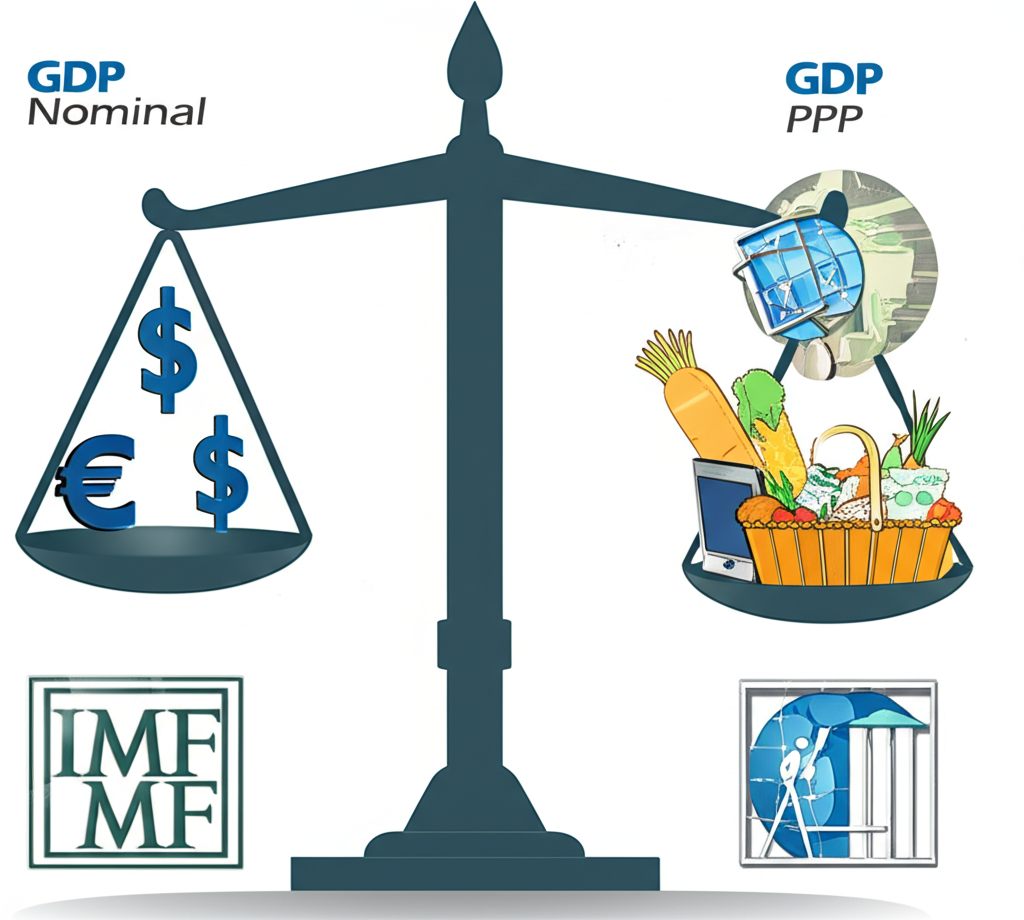
Assessing a nation’s economic size requires reliable metrics, and Gross Domestic Product (GDP) remains the standard benchmark. However, not all GDP measurements tell the same story. The two most widely used approaches—Nominal GDP and GDP based on Purchasing Power Parity (PPP)—offer complementary perspectives. While nominal GDP reflects market value on the global stage, PPP adjusts for differences in living costs, offering a clearer picture of domestic economic strength. Organizations like the International Monetary Fund (IMF) and the World Bank provide authoritative data, enabling consistent cross-country comparisons and informed analysis.
GDP Nominal: The Market Value Approach
Nominal GDP calculates the total value of all final goods and services produced within a country over a specific period, using current exchange rates and market prices. Typically expressed in U.S. dollars, it allows straightforward international comparisons of economic output and financial influence. This measure is particularly useful for evaluating a country’s role in global trade, capital markets, and foreign investment flows. However, because it doesn’t account for variations in price levels or inflation, nominal GDP can understate the real economic activity within countries where goods and services are more affordable. A nation with high output but low domestic prices might appear smaller than it truly is in terms of internal consumption and living standards.
GDP PPP: Reflecting Real Purchasing Power
GDP adjusted for Purchasing Power Parity (PPP) addresses the limitations of nominal GDP by factoring in differences in the cost of living across countries. It estimates how much a common basket of goods and services would cost if purchased locally, converting local currencies into “international dollars” for equitable comparison. This adjustment reveals the true purchasing capacity of a population and provides deeper insight into domestic market size and citizen welfare. For example, a country with lower wage levels and prices may have a modest nominal GDP but a significantly higher PPP GDP, reflecting broader consumption and economic resilience. This metric is especially valuable when assessing emerging markets and long-term development trends.
The World’s Largest Economies by Nominal GDP (2024 Projections)

As of 2024, the global economic hierarchy remains anchored by a core group of industrialized and emerging powerhouses. Nominal GDP rankings highlight countries with the greatest influence in international finance and trade. Below is a list of the top 20 economies based on IMF projections, offering insight into their economic profiles and structural strengths.
| Rank | Country | Projected Nominal GDP (Billions USD) | Key Economic Highlight |
|---|---|---|---|
| 1 | United States | 28,781 | Diverse, innovation-driven, large consumer market |
| 2 | China | 18,533 | Manufacturing hub, rapid technological advancement |
| 3 | Germany | 4,591 | Export-oriented, strong manufacturing, engineering |
| 4 | Japan | 4,110 | Advanced technology, automotive, aging population |
| 5 | India | 4,110 | Fast-growing, IT services, large domestic market |
| 6 | United Kingdom | 3,592 | Financial services, diverse service sector |
| 7 | France | 3,182 | Tourism, luxury goods, strong social welfare |
| 8 | Italy | 2,331 | Fashion, machinery, strong small and medium enterprises |
| 9 | Brazil | 2,331 | Natural resources, agriculture, large domestic market |
| 10 | Canada | 2,242 | Natural resources, energy, strong trade with US |
| 11 | Russia | 2,056 | Energy exports, defense industry |
| 12 | Mexico | 1,993 | Manufacturing, strong trade with US, tourism |
| 13 | Australia | 1,721 | Natural resources, mining, strong service sector |
| 14 | South Korea | 1,709 | High-tech manufacturing, exports, innovation |
| 15 | Spain | 1,602 | Tourism, automotive, renewable energy |
| 16 | Indonesia | 1,470 | Large domestic market, natural resources, agriculture |
| 17 | Netherlands | 1,170 | Trade, logistics, agriculture, high-tech |
| 18 | Saudi Arabia | 1,107 | Oil and gas, diversification efforts |
| 19 | Turkey | 1,105 | Manufacturing, tourism, diverse economy |
| 20 | Switzerland | 939 | Financial services, pharmaceuticals, precision manufacturing |
Note: Figures are IMF projections for 2024 and are subject to revision.
Top 5 Largest Economies by Nominal GDP
The United States continues to lead the global economy by nominal GDP, powered by a vast and affluent consumer base, leadership in technology and innovation, and a diversified economic structure spanning finance, healthcare, entertainment, and advanced manufacturing. China maintains a strong second place, leveraging its position as the world’s factory, extensive infrastructure development, and growing dominance in digital and green technologies. Germany ranks third, driven by its high-precision engineering, robust export sector, and strong industrial supply chains. Japan and India are closely matched at fourth and fifth, each with GDP estimates around $4.11 trillion. Japan’s economy is anchored in high-value manufacturing and robotics, though it faces headwinds from demographic decline. India, in contrast, is gaining momentum through digital transformation, a booming services sector, and a young, expanding workforce.
Remaining Top 10/20 Economies
The United Kingdom and France remain central to Europe’s economic fabric, with economies dominated by financial, professional, and creative services. Brazil and Mexico are emerging as key players in Latin America, combining rich natural resources with growing manufacturing capabilities and proximity to U.S. markets. Canada, Australia, and Saudi Arabia benefit from abundant energy and mineral reserves, though their economic diversification efforts vary. South Korea and Switzerland stand out for their specialized, innovation-driven industries—semiconductors, pharmaceuticals, and precision instruments—that yield high value despite smaller populations. The Netherlands, often overlooked, plays a crucial role as a global trade and logistics hub, particularly through the Port of Rotterdam and advanced agricultural exports.
The World’s Largest Economies by PPP GDP (2024 Projections)
When adjusted for purchasing power, the global economic landscape shifts dramatically. PPP GDP highlights the real scale of domestic economies and consumer markets, particularly in nations where incomes may be lower but living costs are significantly cheaper. This perspective often elevates populous emerging economies, reflecting their substantial internal demand and economic resilience.
| Rank | Country | Projected PPP GDP (Billions USD) | Key PPP Insight |
|---|---|---|---|
| 1 | China | 35,263 | Vast domestic consumption, lower cost of living |
| 2 | United States | 28,781 | High productivity, diverse economy |
| 3 | India | 14,594 | Massive population, lower cost of goods |
| 4 | Japan | 6,560 | High domestic purchasing power despite high prices |
| 5 | Germany | 6,056 | Strong domestic market, efficient production |
| 6 | Russia | 4,874 | Significant domestic purchasing power from resources |
| 7 | Indonesia | 4,683 | Large population, growing middle class |
| 8 | Brazil | 4,370 | Large internal market, abundant resources |
| 9 | United Kingdom | 4,286 | Robust service sector, strong domestic demand |
| 10 | France | 3,865 | Strong social welfare, diverse domestic consumption |
| 11 | Mexico | 3,365 | Growing manufacturing, large domestic market |
| 12 | Turkey | 3,354 | Large domestic market, young population |
| 13 | Italy | 3,245 | Strong domestic consumption, luxury goods |
| 14 | South Korea | 2,959 | High tech, strong domestic market |
| 15 | Saudi Arabia | 2,492 | Resource wealth translated to domestic spending |
| 16 | Spain | 2,427 | Tourism, growing domestic services |
| 17 | Canada | 2,391 | High living standards, stable economy |
| 18 | Australia | 1,775 | High disposable income, strong domestic demand |
| 19 | Egypt | 1,686 | Large population, emerging market |
| 20 | Thailand | 1,563 | Tourism, manufacturing, growing middle class |
Note: Figures are IMF projections for 2024 and are subject to revision.
Under PPP, China emerges as the world’s largest economy, surpassing the United States due to its enormous population and relatively low cost of living. India climbs to third place, underscoring the strength of its domestic market despite lower per capita income. Countries like Russia, Indonesia, and Turkey also see notable improvements in rank, reflecting the purchasing power of their citizens and the scale of internal economic activity. This metric reveals that economic influence isn’t solely about market value—it’s also about consumption, access, and real economic depth.
Future Economic Powerhouses: Projections for 2025, 2026, and 2050
The global economic order is in flux, with long-term trends pointing toward a redistribution of influence from traditional Western powers to dynamic emerging markets. Projections from institutions like the IMF and research firms such as PwC suggest transformative changes over the next few decades, driven by demographic shifts, technological adoption, and policy direction.
Short-Term Outlook: 2025 & 2026 Projections
In the near term, the top-tier economies are expected to maintain their positions, with the United States and China continuing to dominate in nominal terms. However, India is on track for a significant breakthrough, with forecasts indicating it could overtake Germany and Japan to claim third place by nominal GDP within the next few years—possibly as early as 2027. This rise is fueled by strong domestic demand, digital infrastructure expansion, and favorable demographics. Meanwhile, Germany and Japan face structural challenges, including aging populations and slower productivity gains. Indonesia and Mexico are also gaining traction, benefiting from industrialization, foreign investment, and integration into global supply chains, positioning them for steady climbs in the rankings.
留言