

What is the ATR Indicator? Understanding Average True Range

The Average True Range (ATR) stands as one of the most reliable tools in a trader’s technical toolkit, offering a clear window into market volatility. Created by J. Welles Wilder Jr. and introduced in his landmark 1978 book *New Concepts in Technical Trading Systems*, ATR doesn’t attempt to predict price direction. Instead, it focuses purely on measuring the intensity and magnitude of price movement over a defined period. This makes it an essential instrument for assessing risk, adjusting trade size, and identifying potential opportunities based on shifting market dynamics.
Unlike directional indicators such as moving averages or MACD, ATR is non-directional—it reveals how much an asset is moving, not which way. For traders, this distinction is crucial. Knowing that a stock or currency pair is experiencing heightened volatility allows for smarter decisions around position sizing and stop placement, helping to avoid being stopped out prematurely during normal price swings or overexposed during quiet phases.
Over time, ATR has become a staple across trading styles and asset classes. Whether analyzing stocks, forex, commodities, or cryptocurrencies, traders rely on its ability to adapt to changing conditions. By quantifying average price movement, ATR enables a more responsive and disciplined approach to managing risk in real time.
The Role of Volatility in Market Behavior
Volatility lies at the heart of financial markets, shaping everything from trade execution to risk assessment. It reflects how rapidly and significantly an asset’s price changes over time. High volatility often accompanies major news events, earnings reports, or shifts in market sentiment, leading to wide price swings within short periods. In contrast, low volatility suggests consolidation, where prices move within a tight range, often ahead of a breakout.
ATR translates this abstract concept into a measurable value. Rather than relying on gut feeling or visual chart analysis, traders can use ATR to assign a numerical figure to volatility. This number represents the average range between price extremes—factoring in gaps and limit moves—over a specified number of periods. The result is a dynamic reading that evolves with market conditions, giving traders an objective benchmark for evaluating risk.
Understanding volatility through ATR allows for better-informed decisions. For example, placing a fixed stop-loss on a volatile stock may lead to unnecessary exits due to routine fluctuations. Conversely, using a wider stop during low-volatility periods could expose a trader to excessive downside risk if the market suddenly shifts. ATR bridges this gap by offering a volatility-adjusted framework for setting realistic trade parameters.
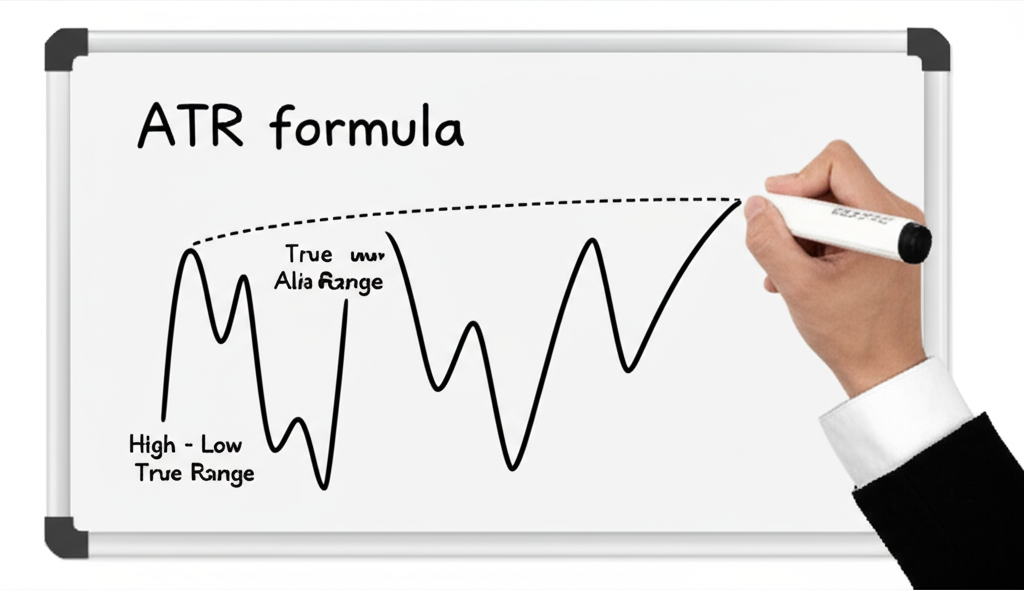
How to Calculate the ATR Indicator: Formula and Components
The strength of ATR lies in its methodical construction. To fully grasp how it works, it’s important to first understand the concept of True Range (TR), the foundational element from which ATR is derived. TR captures the full extent of price movement during a single period, accounting for gaps and overnight jumps that simple high-low ranges might miss.
Step-by-Step True Range Calculation
For any given period—be it a day, hour, or minute—the True Range is determined by identifying the largest of three possible values:
– The difference between the current period’s high and low prices.
– The absolute value of the difference between the current high and the previous period’s close.
– The absolute value of the difference between the current low and the previous period’s close.
Mathematically, this is expressed as:
TR = MAX[(High – Low), |High – Previous Close|, |Low – Previous Close|]
To illustrate, consider the following scenario:
– **Day 1:** High = 105, Low = 100, Close = 103
– **Day 2:** High = 108, Low = 102, Close = 106
Calculating TR for Day 2:
– High – Low = 108 – 102 = 6
– |High – Previous Close| = |108 – 103| = 5
– |Low – Previous Close| = |102 – 103| = 1
The highest value is 6, so the True Range for Day 2 is 6. This method ensures that even if the price gaps up or down from the prior close, the volatility is accurately reflected.
Averaging the True Range to Derive ATR
Once True Range values are calculated for each period, the next step is to average them over a set number of periods. The standard setting, popularized by Wilder, is 14 periods—commonly applied on daily charts but adjustable for intraday or longer-term analysis.
Wilder used a smoothing technique similar to an exponential moving average (EMA), rather than a simple moving average, to ensure recent data carries more weight. This helps the ATR respond more quickly to shifts in volatility while maintaining historical context.
The initial ATR (after the first 14 periods) is typically calculated as the simple average of the first 14 TR values. Subsequent values are computed using the formula:
Current ATR = [(Previous ATR × (n – 1)) + Current TR] / n
Where *n* is the number of periods (e.g., 14).
This smoothed approach prevents abrupt shifts in the ATR line and makes it more reliable for practical use. Resources like StockCharts.com provide detailed visualizations of how this calculation unfolds across real market data.
Interpreting ATR Values: What High and Low Volatility Means
Interpreting ATR is intuitive: higher values indicate greater volatility, while lower values reflect periods of relative calm. When ATR rises, it signals that price swings are widening—often due to increased market participation, breaking news, or strong momentum. A declining ATR suggests consolidation, where traders are观望, and price movement is constrained.
However, it’s essential to recognize that ATR is an absolute measure. An ATR reading of 2.0 means the asset moves, on average, $2 per period—but this has very different implications depending on the asset’s price. For a stock trading at $20, that’s a 10% average move, indicating extreme volatility. For a $200 stock, it’s only 1%, which may be considered normal.
– **High ATR:** Often seen during sharp rallies, sell-offs, or news-driven events. While these conditions offer profit potential, they also increase risk. Breakout traders may thrive here, but whipsaw and false signals are common.
– **Low ATR:** Frequently observed during sideways or range-bound markets. These periods can precede explosive moves—what many refer to as a “volatility squeeze.” Traders often monitor for rising ATR after prolonged lows as a signal that a breakout may be imminent.
Critically, ATR provides no directional insight. A spike in volatility could accompany a strong uptrend, a steep decline, or a choppy back-and-forth. That’s why it should never be used in isolation. Pairing ATR with directional tools—such as trendlines, moving averages, or candlestick patterns—ensures a more complete picture of market behavior.
Practical Applications: How to Use the ATR Indicator in Trading
Beyond its theoretical foundation, ATR shines in practical application. Its real value emerges when used to shape trade execution, risk parameters, and strategic timing.
Setting Effective Stop-Loss Orders with ATR
One of the most powerful uses of ATR is in crafting adaptive stop-loss levels. Fixed stops—such as “$1 below entry”—can be too rigid. In a volatile market, they may trigger too early, cutting winners short. In quieter conditions, they might leave too much capital at risk.
ATR allows traders to set stops that move with the market’s natural rhythm. A common method is to place the stop at a multiple of the current ATR away from the entry point:
– For long positions: Entry price – (ATR × multiplier)
– For short positions: Entry price + (ATR × multiplier)
A multiplier of 1.5x, 2x, or 3x is typical, depending on risk tolerance and trading style. For example, buying a stock at $50 with a 14-period ATR of $0.75 and using a 2x ATR stop would place the stop at $50 – (2 × 0.75) = $48.50. This gives the trade room to breathe while protecting against excessive loss.
Traders also use ATR for trailing stops. As a position moves in profit, the stop is adjusted backward by a multiple of ATR, locking in gains while staying active in strong trends.
Optimizing Position Sizing Based on ATR
Position sizing is where professional risk management separates itself from amateur speculation. ATR enables traders to standardize risk across different assets and market conditions. Instead of risking the same number of shares on every trade, ATR helps determine how many shares to buy based on volatility.
Here’s how it works:
1. Define the maximum dollar amount you’re willing to risk per trade (e.g., 1% of a $10,000 account = $100).
2. Determine your stop-loss distance using ATR (e.g., 2 × current ATR).
3. Divide your risk amount by the stop distance to get the number of shares.
Example:
– Max risk = $100
– Stop distance = 2 × $1.00 ATR = $2.00
– Shares to buy = $100 / $2.00 = 50 shares
This ensures that regardless of whether you’re trading a volatile tech stock or a stable blue-chip, your dollar risk remains consistent. This principle is widely endorsed in professional trading circles and explained in depth on platforms like Investopedia.
Identifying Entry and Exit Points Using ATR
While ATR doesn’t generate direct buy or sell signals, it can enhance entry and exit decisions when combined with price action.
– **Breakout Confirmation:** A price breakout accompanied by a rising ATR suggests strong participation and momentum, increasing confidence in the move’s validity. Conversely, a breakout on low ATR may lack conviction and could fail.
– **Volatility Squeeze:** When ATR reaches multi-week or multi-month lows, it often signals that a breakout is near. Traders may position themselves in anticipation of a move, entering when ATR begins to rise.
– **Exit Signals:** A declining ATR after a strong trend may indicate weakening momentum. This could be a cue to take profits or tighten exits, especially if price action shows signs of exhaustion.
ATR Settings and Optimization for Different Trading Styles
The effectiveness of ATR depends heavily on proper configuration. The number of periods used should align with your trading timeframe and objectives.
ATR for Day Trading and Intraday Strategies
Day traders operate in fast-moving environments and need tools that respond quickly. For this reason, shorter ATR settings—typically between 5 and 10 periods—are preferred. These settings make the indicator more sensitive to recent price changes, allowing for tighter stops and quicker adjustments.
On 5-minute or 15-minute charts, a rising ATR can alert traders to intraday volatility surges, such as those caused by economic data releases or earnings announcements. Conversely, low ATR readings may signal choppy, directionless markets—ideal conditions to stay on the sidelines.
ATR for Swing Trading and Longer-Term Strategies
Swing traders, who hold positions for days or weeks, benefit from longer ATR periods—usually between 20 and 50. These settings smooth out short-term noise and reflect the broader trend’s volatility.
A longer ATR setting allows for wider stop-losses that can withstand normal pullbacks without being triggered. This is particularly useful in strong trends where temporary retracements are common. It also helps filter out minor fluctuations that might distract from the bigger picture.
Advanced ATR Strategies: Combining with Other Indicators
ATR becomes even more powerful when integrated with other technical tools. These combinations allow traders to build more robust, multi-layered strategies.
ATR with Moving Averages for Trend Confirmation
Moving averages help identify trend direction. When paired with ATR, they can also confirm trend strength. For example:
– A breakout above a 50-day moving average, combined with a rising ATR, suggests strong momentum and broad market participation.
– A weak breakout on a flat or declining ATR may lack follow-through and should be treated with caution.
Traders also use moving averages as dynamic support/resistance levels while using ATR to set trailing stops. For instance, staying long as long as price remains above the 20-period EMA, with a stop set at 1.5x ATR below the recent swing low.
Enhancing Bollinger Bands with ATR for Volatility Squeeze Plays
Bollinger Bands contract during low-volatility periods, signaling a potential breakout. ATR can confirm this setup:
– When Bollinger Bands tighten *and* ATR reaches multi-period lows, it reinforces the idea of a coiled spring ready to snap.
– A subsequent expansion in both Bollinger Bands and ATR confirms the breakout’s strength and direction.
This dual confirmation reduces false signals and improves timing. Traders often use this setup to enter at the early stages of a new trend, maximizing reward potential.
Limitations and Common Pitfalls of the ATR Indicator
Despite its strengths, ATR has limitations that traders must understand to avoid costly mistakes.
– **Lagging Nature:** ATR is based on past data and reacts to volatility rather than predicting it. It cannot forecast future swings but only reflects recent activity.
– **No Directional Insight:** High ATR could mean a strong uptrend, a steep drop, or a sideways grind. Always pair it with directional tools.
– **Setting Sensitivity:** The choice of period affects performance. Too short, and it becomes noisy; too long, and it becomes sluggish. Traders should test settings across different assets and timeframes.
– **Context-Dependent Values:** An ATR of $1.50 means very different things for a $10 stock versus a $300 stock. Always assess ATR relative to price and historical norms.
ATR in Ranging vs. Trending Markets
ATR behaves differently across market environments:
– In **trending markets**, ATR tends to remain elevated as price moves consistently in one direction. This makes it ideal for setting adaptive stops that allow trends to develop.
– In **ranging markets**, ATR often declines as price oscillates within a narrow band. While low ATR can signal a coming breakout, it’s less effective for stop placement during prolonged consolidation, where price movements are minimal.
Expert Tips for Professional ATR Usage
Top traders don’t treat ATR as a standalone signal but as a dynamic input in a broader decision-making framework. Here’s how they use it effectively:
1. **Prioritize Context:** Always interpret ATR relative to the asset’s price, sector, and historical volatility. A $5 ATR might be normal for a commodity but extreme for a small-cap stock.
2. **Adjust Risk Dynamically:** When ATR spikes, professionals often reduce position size to maintain consistent dollar risk. This prevents overexposure during turbulent times.
3. **Combine with Price Action:** A high ATR on a strong bullish candle confirms momentum. The same ATR on a doji or spinning top may signal indecision.
4. **Use Multi-Timeframe Analysis:** Check ATR on higher timeframes to understand the broader environment. A low daily ATR with rising hourly ATR could indicate a short-term breakout within a larger consolidation.
5. **Avoid Over-Optimization:** Don’t constantly tweak the period setting. Choose a value that aligns with your style and stick with it to ensure consistency.
6. **Apply Discretion:** ATR provides objective data, but its application requires judgment. Use it as a guide, not a rigid rule.
Conclusion: Leveraging ATR for Smarter Trading Decisions
The Average True Range is more than just a volatility meter—it’s a cornerstone of disciplined trading. By providing an objective measure of price movement, ATR empowers traders to manage risk intelligently, size positions appropriately, and time entries and exits with greater precision. It doesn’t tell you where price is going, but it tells you how forcefully it’s moving, which is often just as important.
When integrated thoughtfully into a trading plan—paired with directional indicators, price action, and sound risk principles—ATR becomes a powerful ally. Whether you’re a day trader navigating intraday swings or a swing trader riding multi-week trends, ATR helps you adapt to the ever-changing rhythm of the market. Its simplicity, versatility, and practicality ensure its place as a must-have tool in any trader’s arsenal.
What is the recommended ATR setting for daily charts?
The most commonly recommended and standard ATR setting for daily charts is 14 periods. This setting provides a balance between responsiveness to recent volatility and smoothing out short-term noise, making it suitable for swing trading and longer-term analysis.
Can the ATR indicator be used for all types of assets, such as stocks, forex, and cryptocurrencies?
Yes, the ATR indicator is universally applicable to virtually all types of financial assets that exhibit price movement, including stocks, forex, commodities, indices, and cryptocurrencies. Its core function is to measure volatility, which is a characteristic of all tradable markets.
How does ATR differ from other volatility indicators like Bollinger Bands or Keltner Channels?
While all are volatility indicators:
- **ATR** provides an absolute measure of average price range, useful for stop-loss and position sizing.
- **Bollinger Bands** plot standard deviations from a moving average, showing relative volatility and potential overbought/oversold conditions.
- **Keltner Channels** use ATR (or a multiple of it) to define bands around a moving average, similar to Bollinger Bands but often smoother and less prone to false signals.
Is the ATR indicator effective for identifying market trends, or is it solely a volatility measure?
The ATR indicator is solely a volatility measure and is not designed to identify market trends or direction. It tells you the magnitude of price movement, not whether that movement is up or down. To identify trends, ATR should be used in conjunction with directional indicators like Moving Averages or MACD.
What are the main drawbacks of relying solely on the ATR indicator for trading decisions?
The main drawbacks include:
- It is a lagging indicator, based on past data.
- It provides no directional information.
- Its absolute values require contextual interpretation relative to the asset’s price.
- It can give misleading signals in ranging markets if not combined with other tools.
How can I integrate ATR into my existing trading platform, such as TradingView or MetaTrader?
Most modern trading platforms like TradingView and MetaTrader (MT4/MT5) have the ATR indicator built-in. You can usually add it to your chart by:
- Opening the “Indicators” or “Studies” menu.
- Searching for “Average True Range” or “ATR”.
- Clicking to apply it to your chart and adjusting the period setting as needed.
What does a high ATR value typically indicate, and how should traders react to it?
A high ATR value indicates that the asset is experiencing significant price swings and high volatility. Traders should react by:
- Considering smaller position sizes to manage increased risk.
- Setting wider stop-loss orders to avoid premature exits.
- Being prepared for potentially rapid price movements and increased market noise.
Are there specific timeframes where the ATR indicator is more reliable or effective?
ATR is effective across all timeframes, but its interpretation and optimal settings vary. It’s highly reliable for day trading (shorter periods) to gauge intraday volatility and for swing/position trading (longer periods) to understand broader market movements. The key is to match the ATR period to your trading timeframe and style.
Can ATR be used in conjunction with support and resistance levels?
Absolutely. ATR can help define the “strength” of support and resistance levels. For instance, if price breaks a key resistance level with increasing ATR, it suggests a more conviction-driven breakout. Conversely, if price approaches a support level with low ATR, it might indicate consolidation before a potential bounce or a weak breakdown.
How do professional traders use ATR to manage risk and protect their capital?
Professional traders use ATR primarily for dynamic risk management:
- **Adaptive Stop-Losses:** Placing stops at multiples of ATR to accommodate current volatility.
- **Position Sizing:** Calculating the number of shares/contracts to trade based on ATR-derived stop distance and predefined risk per trade.
- **Volatility Filters:** Avoiding trades in excessively high or low ATR environments that don’t suit their strategy.
- **Trailing Stops:** Adjusting stop-losses as a trade progresses in profit, using ATR to define the trailing distance.
留言