

Introduction: Navigating the Market with Predictive Power
In the high-speed world of financial markets, timing can make the difference between profit and loss. Traders who can anticipate shifts before they become obvious often gain a crucial edge. While many rely on past price behavior to guide decisions, the real advantage lies in tools that offer a forward-looking perspective—specifically, leading indicators. These technical tools are designed not just to reflect history but to forecast what might come next. By analyzing patterns in price momentum, volume, and sentiment, leading indicators aim to detect early signs of trend reversals or emerging opportunities. This guide explores how these predictive instruments work, how they differ from other analytical tools, and how you can integrate them into a strategic approach that prioritizes foresight over reaction.

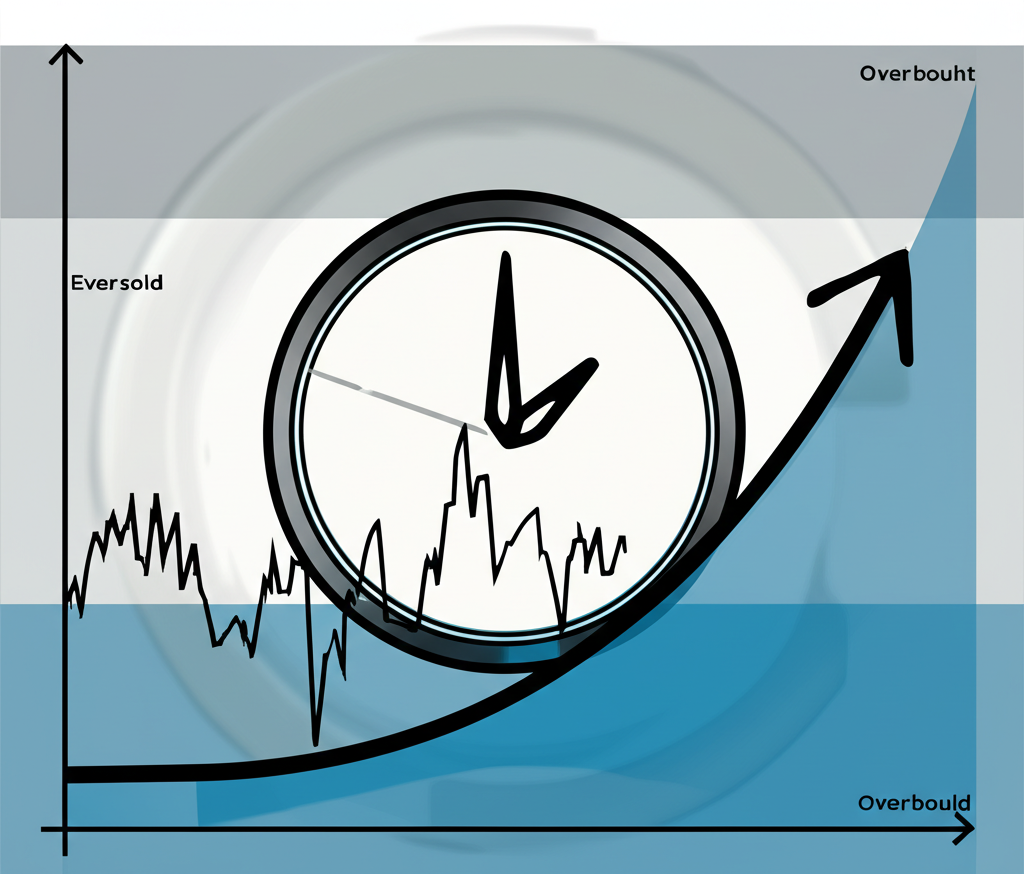
What Are Leading Indicators in Trading?
Leading indicators are technical tools engineered to forecast future price movements rather than simply confirming current trends. Unlike lagging measures that follow price action, these indicators attempt to identify turning points before they fully materialize. They are grounded in the idea that changes in momentum, volume, or sentiment often precede actual price shifts. For example, if a stock is rising sharply but momentum is waning, a leading indicator might signal that the uptrend is losing strength—even before the price starts to fall.

The Core Principle: Anticipating Market Moves
At their core, leading indicators operate on the belief that market psychology leaves traces before major moves occur. When buyers or sellers become overly aggressive, conditions like overbought or oversold levels can form, hinting at an impending correction. Similarly, divergences between price and momentum suggest weakening conviction behind a trend. These subtle clues allow traders to position themselves ahead of broader market recognition. Instead of chasing a move, they can enter early—potentially capturing more of the trend’s lifespan. This proactive stance stands in contrast to reactive strategies, where traders wait for confirmation that often comes at a less favorable price point.
Leading vs. Lagging vs. Coincident Indicators: A Clear Distinction
To use any indicator effectively, it’s essential to understand its role in the broader analytical framework. Technical indicators fall into three main categories—leading, lagging, and coincident—each serving a unique function in market analysis. A well-rounded trading strategy typically draws from all three to balance prediction, confirmation, and real-time insight.
| Indicator Type | Primary Function | Timing of Signal | Key Benefit | Common Examples |
| :————- | :————— | :—————- | :———- | :————– |
| **Leading** | Predicts future movements | Before price change | Early entry/exit | RSI, Stochastic Oscillator, Williams %R |
| **Lagging** | Confirms existing trends | After price change | Trend validation | Moving Averages, MACD |
| **Coincident** | Describes current market | During price change | Real-time snapshot | Volume, Price Action |
Lagging Indicators: Confirming Trends
Lagging indicators follow price action, generating signals only after a trend has already established itself. Their strength lies in validation: they help traders confirm whether a movement is sustainable or merely a temporary fluctuation. For instance, a 50-day moving average crossing above a 200-day moving average (a “golden cross”) confirms bullish momentum—but only after the trend has gained traction. While this reduces the risk of false signals, it also means entries often come at higher prices. The MACD, despite frequent misclassification, belongs in this category. Since it’s built from moving averages, its signals appear after price shifts, making it a trend-confirmation tool rather than a predictive one.
Coincident Indicators: Real-Time Market Insight
Coincident indicators reflect what is happening in the market right now. They don’t predict the future, but they provide critical context about current conditions. Volume is the most prominent example. A breakout accompanied by high volume suggests strong participation and increases the likelihood that the move will continue. Conversely, a price rise on low volume may indicate lack of conviction, warning of a potential false breakout. These real-time signals help traders assess the quality of price action as it unfolds, making them indispensable for short-term decision-making.
The Advantages of Using Leading Indicators in Your Trading Strategy
When applied correctly, leading indicators can significantly enhance trading performance by providing early warnings and strategic advantages.
- Early Entry and Exit Opportunities: By identifying potential reversals or trend beginnings ahead of the crowd, traders can enter at better prices and exit before downturns accelerate.
- Increased Profit Potential: Early entries allow traders to capture more of a trend’s full range, improving overall return on successful trades.
- Timely Trend Reversal Detection: Tools like RSI and Stochastic excel at highlighting overbought and oversold conditions, often catching reversals before they’re visible on price alone.
- Enhanced Risk Management: Early signals enable tighter stop placements and proactive profit protection, helping traders avoid being caught off guard by sudden market shifts.
These benefits make leading indicators particularly valuable for swing traders and active investors who rely on timing to maximize returns.
Understanding the Limitations and Risks
Despite their predictive appeal, leading indicators are far from foolproof. Their forward-looking nature comes with inherent risks that traders must manage carefully.
- False Signals (Whipsaws): Because they anticipate rather than confirm, leading indicators frequently generate signals that fail to materialize. These “whipsaws” can lead to repeated losses, especially in choppy or sideways markets.
- Interpretation Variability: Identifying divergences or overbought readings can be subjective. Two traders might interpret the same RSI pattern differently, leading to inconsistent decisions.
- Over-Reliance Danger: Relying solely on one indicator—no matter how popular—increases vulnerability. Markets are complex, and no single tool captures all variables.
- Need for Confirmation: Due to their high false signal rate, leading indicators should rarely be used alone. They perform best when combined with trend filters, price action, or lagging confirmation tools.
Recognizing these limitations is the first step toward using leading indicators wisely.
Key Examples of Leading Indicators for Traders
Several leading indicators have stood the test of time due to their effectiveness and adaptability across markets. Understanding how each works—and how to interpret their signals—is key to leveraging their full potential.
Relative Strength Index (RSI)
The Relative Strength Index (RSI), developed by J. Welles Wilder Jr., measures the speed and magnitude of recent price changes on a scale from 0 to 100. It’s one of the most widely used momentum oscillators in technical analysis.
- Overbought/Oversold Levels: Readings above 70 suggest a security may be overbought and due for a pullback, while readings below 30 indicate oversold conditions and possible upward correction.
- Divergences: A bullish divergence forms when price hits a lower low but RSI marks a higher low—indicating hidden buying strength. A bearish divergence occurs when price reaches a higher high but RSI peaks lower, signaling weakening momentum.
- Centerline Crossovers: While secondary, a move above 50 can suggest strengthening bullish momentum, while a drop below 50 may reflect growing bearish pressure.
RSI is particularly effective in ranging markets, though it can give misleading signals during strong trends.
Stochastic Oscillator
Also created by Wilder, the Stochastic Oscillator compares a security’s closing price to its price range over a specified period, typically 14 days. It consists of two lines: %K (fast) and %D (slow), both oscillating between 0 and 100.
- Overbought/Oversold Zones: Levels above 80 are considered overbought; below 20, oversold. These thresholds help identify potential turning points.
- Signal Line Crossovers: A buy signal occurs when %K crosses above %D in the oversold zone. A sell signal is triggered when %K crosses below %D in the overbought region.
- Divergence Analysis: Like RSI, divergences between price and the Stochastic lines can foreshadow reversals, offering early clues before price confirms the shift.
This indicator is especially popular in forex and commodities trading, where momentum shifts are frequent.
Williams %R
Williams %R, developed by Larry Williams, functions similarly to the Stochastic Oscillator but is inverted and ranges from 0 to -100.
- Interpretation: Values between 0 and -20 indicate overbought conditions, while readings between -80 and -100 suggest oversold levels.
- Reversal Signals: A move from below -80 back toward -50 can signal a bottom forming. Conversely, a drop from above -20 into lower territory may indicate a short-term top.
Traders often use Williams %R to fine-tune entries in volatile markets, where quick reversals are common.
Commodity Channel Index (CCI)
The Commodity Channel Index (CCI) measures the variation of a security’s price from its statistical mean. Originally designed for commodities, it’s now widely used across asset classes.
- Extreme Conditions: CCI values above +100 suggest strong upward momentum, potentially signaling a new uptrend or overbought condition. Values below -100 indicate strong downward pressure.
- Early Trend Detection: Unlike many indicators that react to price, CCI can detect momentum shifts early, making it valuable for spotting emerging trends.
- Divergences: As with RSI and Stochastic, divergences between price and CCI can precede major reversals.
Its sensitivity makes CCI ideal for active traders, though it requires careful filtering to avoid noise.
On-Balance Volume (OBV)
On-Balance Volume (OBV) is a cumulative volume-based indicator that links volume flow to price changes.
- Trend Confirmation: A rising OBV line confirms an uptrend by showing that volume is stronger on up days. A falling OBV supports a downtrend.
- Hidden Divergences: If price climbs to new highs but OBV fails to do so, it suggests a lack of volume support—often a precursor to reversal.
OBV is especially useful in spotting institutional activity, as large volume shifts often precede price moves.
How to Effectively Use Leading Indicators in Your Trading Strategy
Mastering leading indicators goes beyond knowing how they work—it requires a disciplined approach to application and interpretation.
Identifying Entry and Exit Points
Leading indicators shine when identifying inflection points. For example, an RSI reading dropping below 70 after being overbought, especially with a bearish divergence, could signal a timely exit from a long position. Similarly, a Stochastic crossover from below 20 might mark an ideal entry point in a pullback. The key is not to act on every signal but to look for high-probability setups where multiple conditions align.
Confirming Trend Reversals and Continuations
While reversal signals are the hallmark of leading indicators, they also help assess trend strength. A sustained CCI above +100 can confirm a powerful bullish trend, while repeated RSI overbought readings without reversal may indicate a strong uptrend in progress. Divergences, however, remain one of the most reliable reversal warnings—especially when they occur at key support or resistance levels.
Combining Leading Indicators for Stronger Signals
Using multiple leading indicators together increases signal reliability. For instance, a bullish RSI divergence combined with a Stochastic crossover in oversold territory creates a confluence of evidence that strengthens the trade case. This multi-layered approach filters out random noise and improves decision quality. However, avoid overloading charts with redundant tools—focus on complementary indicators that measure different aspects of market behavior.
Advanced Strategies & Risk Management with Leading Indicators
As traders gain experience, they refine how they apply leading indicators, tailoring them to specific markets, timeframes, and risk profiles.
Tailoring Indicators for Different Timeframes (Day Trading vs. Swing Trading)
Timeframe dictates how leading indicators should be configured. Day traders often use shorter periods—such as a 7-period RSI—to capture rapid momentum shifts. However, this increases sensitivity and the risk of false signals. Swing traders, aiming to capture multi-day moves, benefit from longer settings like a 21-period Stochastic, which smooths out short-term volatility and focuses on higher-probability swings. Adjusting lookback periods to match trading style is critical for optimal performance.
Debunking Common Misconceptions (e.g., MACD as a leading indicator)
A widespread myth is that MACD is a leading indicator. In reality, it’s derived from moving averages, which are inherently lagging. While MACD can show momentum shifts, its signals emerge after price changes, making it a trend-confirmation tool. Similarly, while volume can offer early clues, it’s classified as a coincident indicator because it reflects current trading activity, not future price direction. Accurate classification ensures proper usage and avoids flawed strategy design.
Integrating Leading Indicators with Other Technical Tools (Price Action, Chart Patterns)
The most robust trading setups combine leading indicators with price action and chart patterns. For example, an overbought RSI reading becomes far more compelling when it coincides with a bearish engulfing pattern at a resistance level. Or a bullish divergence gains strength when it aligns with the completion of a double bottom pattern. This convergence of signals from different analytical lenses increases confidence and win rate.
Risk Management and Position Sizing When Using Predictive Signals
Because leading indicators forecast probabilities, not certainties, risk management is non-negotiable. Traders should define risk per trade—typically 1% to 2% of capital—and set stop-losses based on price structure, not indicator levels. For example, a long trade based on a bullish RSI crossover should have a stop below the recent swing low. Position size should then be adjusted so that the potential loss stays within the risk limit. This discipline ensures survival during inevitable false signals.
Conclusion: Empowering Your Trading Decisions
Leading indicators offer a powerful window into potential market movements, enabling traders to act before trends fully develop. They enhance timing, improve entry and exit points, and support proactive risk management. However, their predictive nature demands caution. Used in isolation, they can mislead. The most successful traders combine them with lagging confirmation, price action analysis, and strict risk controls. Through continuous testing, adaptation, and disciplined execution, leading indicators become not just tools, but strategic allies in navigating the complexities of modern financial markets.
Frequently Asked Questions About Leading Indicators in Trading
1. What is the main difference between leading and lagging indicators?
The main difference lies in their timing relative to price action. Leading indicators attempt to predict future price movements or trend reversals before they occur. Lagging indicators, conversely, confirm existing trends or reversals after they have already begun.
2. Which are the most accurate leading indicators for day trading?
Accuracy is subjective and depends on market conditions and the trader’s strategy. However, for day trading, momentum oscillators like the Relative Strength Index (RSI) and the Stochastic Oscillator are widely used. Traders often adjust their settings to be more sensitive to short-term price fluctuations. It’s crucial to combine them with price action and other forms of analysis to filter out false signals.
3. Is RSI considered a leading or lagging indicator in technical analysis?
RSI (Relative Strength Index) is primarily considered a leading indicator. It helps identify overbought and oversold conditions and potential divergences, which can signal impending price reversals before they fully unfold.
4. Can MACD be used as a leading indicator, or is it always lagging?
The MACD (Moving Average Convergence Divergence) is fundamentally a lagging indicator. While it provides insights into momentum, its calculations are based on moving averages, which by nature follow price. Therefore, MACD signals typically confirm a trend or reversal after it has already started, rather than predicting it.
5. How can I combine multiple leading indicators for better trading signals?
Combining multiple leading indicators involves looking for confluence—when several indicators provide similar signals simultaneously. For example, if RSI shows a bullish divergence while the Stochastic Oscillator also gives a bullish crossover in the oversold zone, this combined signal is much stronger than either indicator alone. This approach helps to validate signals and reduce false positives.
6. What are the key risks associated with relying solely on leading indicators?
The primary risks include a high frequency of false signals (whipsaws), which can lead to premature entries or exits and subsequent losses. Over-reliance can also result in poor decision-making due to the subjective interpretation of signals and the inherent uncertainty of predictions. It’s crucial to always use them in conjunction with other analysis tools and strict risk management.
7. Are there any leading indicators specifically for forex trading?
While many technical indicators are universal across markets, momentum oscillators like RSI, Stochastic Oscillator, and CCI are particularly popular and effective in forex trading due to the highly liquid and trend-prone nature of currency pairs. Traders often adapt their settings to specific currency pair characteristics and timeframes.
8. How do economic leading indicators relate to technical leading indicators in trading?
Economic leading indicators (e.g., manufacturing new orders, building permits) forecast future economic activity, which can indirectly influence market trends over the long term. Technical leading indicators, on the other hand, are based on price and volume data and directly predict short-to-medium-term price movements within the market itself. While both are “leading,” they operate on different scales and data types.
9. What is the best way to backtest leading indicators for my trading strategy?
The best way to backtest leading indicators is to apply them to historical data for the specific asset and timeframe you trade. Use trading software or platforms that allow you to simulate trades based on indicator signals and evaluate their performance (profitability, drawdowns, win rate) over a significant period. This helps you understand how the indicator would have performed in the past and refine your strategy.
10. How can I avoid false signals when using leading indicators?
To avoid false signals, consider these strategies:
- Confirm with other indicators: Use multiple indicators (both leading and lagging) for confluence.
- Integrate with price action: Look for confirmation from candlestick patterns, support/resistance levels, or trendlines.
- Use multiple timeframes: Confirm signals on a lower timeframe with the prevailing trend on a higher timeframe.
- Adjust settings: Experiment with indicator settings to find what works best for your specific market and timeframe.
- Practice risk management: Always use stop-losses to protect against unexpected moves, even with strong signals.
留言