

Introduction to CFD Trading Strategies

In the fast-moving world of modern finance, Contract for Difference (CFD) trading has become a go-to method for traders who want to profit from price changes without actually owning the underlying assets. Whether it’s stocks, commodities, indices, or forex, CFDs offer flexibility and access to global markets with relatively low capital requirements. But success in this arena isn’t just about spotting trends or reacting quickly—it hinges on having a clear, well-thought-out strategy. Without one, even experienced traders can fall victim to impulsive decisions and unexpected losses. This guide breaks down the most effective CFD trading strategies, from lightning-fast scalping to long-term position trades, giving you the tools to craft a personalized, sustainable approach tailored to your goals and risk appetite.
What Are CFDs and Why Do Strategies Matter?
At its core, a Contract for Difference (CFD) is a derivative product that lets traders speculate on whether an asset’s price will rise or fall. When you open a CFD trade, you’re agreeing with your broker to exchange the difference in the asset’s price between when the position opens and closes. One of the most powerful—and potentially dangerous—features of CFDs is leverage. It allows you to control large positions using only a fraction of the total value as margin. For example, with 1:30 leverage, a $1,000 deposit can control $30,000 worth of exposure. While this magnifies gains when trades go your way, it also means losses can accumulate rapidly if the market moves against you. That’s why a solid trading strategy isn’t optional—it’s essential. Without rules around entry, exit, and risk, emotions like fear and greed often take over, leading to inconsistent results and account drawdowns. A structured plan keeps you grounded, helping you stay focused on logic rather than impulse.
Core CFD Trading Strategies Explained
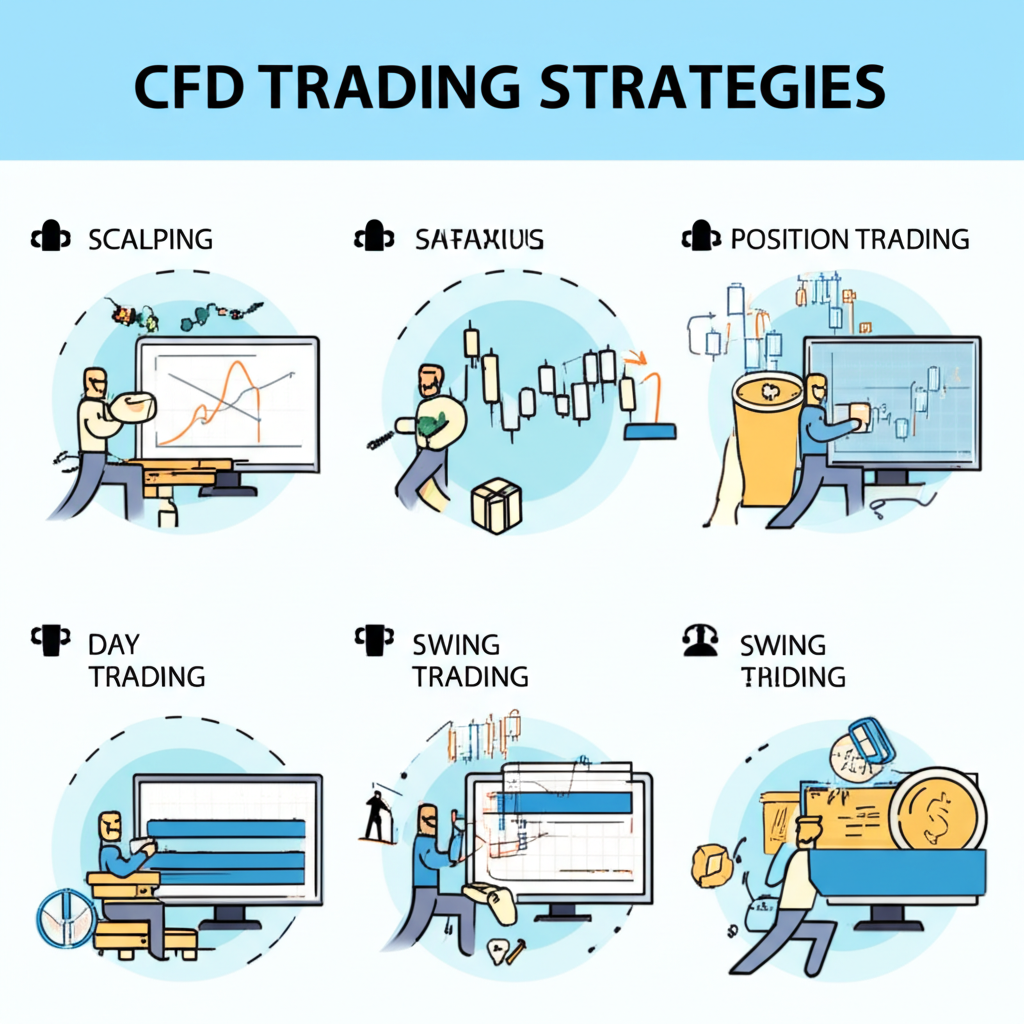
Choosing the right CFD trading strategy depends on your personality, schedule, risk tolerance, and market knowledge. Each approach comes with unique demands in terms of time, attention, and analytical focus. Understanding these differences helps you align your method with your lifestyle and objectives, increasing your chances of long-term consistency.
Scalping: High-Frequency, Low-Profit Trading
Scalping is all about speed and precision. Traders using this strategy aim to capture tiny price movements, often holding positions for just seconds or a few minutes. The goal isn’t massive wins per trade—it’s consistent, small gains that add up over dozens or even hundreds of trades in a single day. This style requires intense concentration, quick reflexes, and near-constant screen time. It works best in highly liquid and volatile markets where frequent price swings create entry and exit opportunities. Common tools include Bollinger Bands to detect volatility squeezes, MACD for momentum shifts, and Stochastic Oscillators to spot overbought or oversold conditions—typically applied on 1-minute or 5-minute charts. Success in scalping comes down to discipline: exiting losers fast, taking profits promptly, and avoiding the temptation to hold for bigger moves.
Day Trading: Navigating Intra-Day Price Movements
Day trading focuses on capturing price action within a single trading session. All positions are opened and closed before the market closes, eliminating overnight risk from gaps or unexpected news. Day traders thrive on short-term volatility, reacting to breakouts, trend reversals, and news-driven spikes. This approach demands a strong grasp of technical analysis and real-time decision-making. Popular tools include the Volume Weighted Average Price (VWAP), which helps identify fair value during the day, RSI for spotting momentum extremes, and candlestick patterns like engulfing bars or dojis that signal potential turning points. Since positions rarely last more than a few hours, traders must remain alert throughout market hours. The key is identifying short-lived inefficiencies—like delayed reactions to economic data—and capitalizing on them before the market corrects.
Swing Trading: Capturing Medium-Term Trends
Swing trading sits between short-term and long-term approaches, with positions typically held for several days to a few weeks. Instead of chasing intraday noise, swing traders focus on broader price swings within an established trend. This method suits those who can’t monitor markets constantly but still want to be actively involved. By analyzing daily or weekly charts, traders look for signs of trend continuation or reversal using tools like Moving Averages to confirm direction, Stochastic Oscillators to gauge momentum exhaustion, and Fibonacci Retracements to anticipate where pullbacks might end. Patience is crucial—swing traders need to ride out minor counter-trend moves without panicking. Because trades last longer, this strategy allows more time for analysis and reduces the pressure of split-second decisions.
Position Trading: Long-Term Market Bets
Position trading is the longest time horizon in the CFD world, with trades lasting weeks, months, or even years. These traders aren’t swayed by daily fluctuations—they’re focused on macro trends driven by fundamentals like interest rates, economic cycles, geopolitical shifts, or corporate performance. While technical analysis still plays a role, it’s usually done on weekly or monthly charts using long-term indicators such as 100-day or 200-day Moving Averages to confirm trend strength. Position traders need deep market insight, strong conviction, and enough capital to withstand drawdowns. This approach involves fewer trades and less screen time, but requires confidence in long-term forecasts and the emotional resilience to stay the course during volatile periods.
Essential Tools & Techniques for CFD Strategy Implementation
No strategy works without reliable tools. Whether you’re entering a quick scalping setup or planning a multi-week position trade, the right analytical methods help you make informed, objective decisions.
Mastering Technical Analysis for CFDs
Technical analysis revolves around studying historical price and volume data to forecast future movements. For CFD traders, it’s invaluable for timing entries and exits. Charts reveal patterns that reflect market psychology—like fear, greed, and indecision—giving clues about where prices might go next. Common formations include head and shoulders (potential reversal), double tops/bottoms (resistance/support tests), and triangle patterns (consolidation before breakout). Candlestick patterns like hammers, shooting stars, and bullish/bearish engulfing bars also provide insight into short-term sentiment. When combined with volume analysis, these signals become even more powerful, helping confirm whether a move has genuine momentum behind it.
Key Technical Indicators Every CFD Trader Should Know
These mathematical tools are plotted on price charts to highlight trends, momentum, and potential turning points:
- Moving Averages (SMA, EMA): These smooth out price data to reveal the underlying trend. A Simple Moving Average treats all data points equally, while an Exponential Moving Average gives more weight to recent prices, making it more responsive. Traders watch for crossovers—such as the 50-day EMA crossing above the 200-day EMA (a “golden cross”)—as potential buy signals.
- Relative Strength Index (RSI): This momentum oscillator ranges from 0 to 100 and helps identify overbought (above 70) or oversold (below 30) conditions. While not a standalone signal, RSI divergences—when price makes a new high but RSI doesn’t—can warn of weakening momentum.
- Moving Average Convergence Divergence (MACD): This combines two moving averages into a single indicator that shows both trend and momentum. A bullish signal occurs when the MACD line crosses above its signal line; bearish when it crosses below. Divergences between MACD and price can also hint at reversals.
- Fibonacci Retracements: Based on natural ratios, these horizontal levels (23.6%, 38.2%, 50%, 61.8%) help predict where a pullback might find support or resistance. They’re especially useful in trending markets after strong moves.
- Support & Resistance Levels: These are key price zones where buying or selling pressure has historically emerged. Support acts as a floor where demand increases; resistance as a ceiling where supply dominates. Breakouts above resistance or breakdowns below support often lead to significant moves.
Incorporating Fundamental Analysis
While technical analysis answers *when* to trade, fundamental analysis addresses *why*. It involves assessing the intrinsic value of an asset by examining economic data, company earnings, central bank policies, and geopolitical events. For swing and position traders, this context is vital. For example, a bullish chart pattern in a stock may lose credibility if upcoming earnings are expected to disappoint. Similarly, a currency pair might reverse despite technical strength if a central bank signals a dovish policy shift. By combining fundamental insights with technical timing, traders can align their positions with broader market forces, increasing the probability of success.
Risk Management: The Cornerstone of Sustainable CFD Trading
No matter how skilled you are, poor risk management can wipe out your account quickly. Given the leveraged nature of CFDs, protecting capital isn’t just smart—it’s survival.
Implementing Stop-Loss and Take-Profit Orders
Automated orders are among the most effective tools for staying disciplined. A **stop-loss order** closes a trade automatically if the price moves against you by a set amount, limiting losses. A **take-profit order** locks in gains when the price reaches a target level. These remove emotion from the equation—no second-guessing, no hesitation. Stop-losses are typically placed below support for long trades or above resistance for shorts. Take-profits often align with key resistance levels (for longs) or support (for shorts), or follow a favorable risk-reward ratio—such as aiming for three times the potential loss. Consistently applying these rules builds consistency over time.
Position Sizing and Capital Allocation
How much should you risk on a single trade? The answer lies in position sizing. A widely accepted rule is to risk no more than 1–2% of your total trading capital per trade. For example, with a $10,000 account, your maximum loss per trade should be $100–$200. Your position size is then calculated so that if your stop-loss is hit, the loss stays within that range. This protects your account from being wiped out by a few bad trades. Capital allocation goes a step further—deciding how much of your total funds to allocate to CFD trading versus other investments. Diversifying across asset classes or markets can also reduce overall portfolio risk.
Understanding Leverage and Margin Risks
Leverage lets you trade larger positions with less capital, but it’s a double-edged sword. A 1:30 leverage ratio means a $1,000 deposit controls $30,000 in exposure. While this boosts potential returns, it equally magnifies losses. If the market moves against you, your losses can exceed your initial deposit. Brokers monitor your account equity relative to required margin. If losses erode your equity below a certain threshold, you’ll receive a **margin call**, requiring additional funds or forced liquidation of positions. According to regulatory reports, a high percentage of retail CFD traders lose money—often due to overuse of leverage and inadequate risk controls. The European Securities and Markets Authority (ESMA) has repeatedly warned about the risks faced by retail investors in CFDs, reinforcing the need for caution and education.
Trading Psychology and Discipline for CFD Success
Even with perfect strategies and tools, trading psychology can make or break your results. The mental game is often what separates consistent performers from those who flame out.
Managing Emotions: Fear, Greed, and Impulsivity
Fear can cause hesitation—missing good entries—or lead to cutting winners too early. Greed, on the other hand, makes traders hold losing positions hoping for a turnaround, or chase oversized profits without proper planning. Impulsivity shows up as revenge trading after a loss, jumping into trades without confirmation, or ignoring your rules during volatile sessions. Overcoming these impulses requires self-awareness and structure. Stick to your trading plan religiously, avoid trading when emotionally charged, and remember that every trader experiences losses—it’s how you respond that matters.
The Importance of a Trading Journal
A trading journal is your personal performance tracker. Record every trade: entry and exit points, reasons for taking the trade, market conditions, emotions felt, and the outcome. Over time, this log becomes a powerful tool for self-improvement. You’ll start to see patterns—maybe certain setups fail repeatedly, or you perform worse after a loss. Reviewing your journal weekly helps refine your strategy, strengthen discipline, and build confidence through data-driven insights.
Crafting Your Personalized CFD Trading Plan
A trading plan is your roadmap. It turns vague ideas into actionable steps and prevents emotional drift during market stress.
Key Components of a Robust Trading Plan
Your plan should be detailed but flexible enough to evolve with your experience.
- Trading Goals: Set specific, measurable objectives—like achieving a 5% monthly return with no more than a 2% drawdown.
- Market Analysis Methods: Define which assets you’ll trade, your preferred timeframes, and the mix of technical and fundamental tools you’ll use.
- Entry/Exit Rules: Be specific—e.g., “Enter long when 50-day EMA crosses above 200-day EMA and RSI is above 50.”
- Risk Management Parameters: State your max risk per trade, stop-loss rules, and profit targets.
- Position Sizing: Outline how you calculate trade size based on stop distance and account risk.
- Daily Routine: Include pre-market analysis, in-session monitoring habits, and post-market journaling.
- Self-Assessment Criteria: Decide how often to review performance and what metrics matter most.
Adapting Your Strategy to Market Conditions
Markets aren’t static. A strategy that thrives in a strong trending environment may fail in a choppy, sideways market. Trend-following systems work best when momentum is clear; oscillators like RSI perform better in range-bound conditions. Smart traders monitor market regime shifts—using volatility measures, volume trends, or correlation changes—and adjust their tactics accordingly. Maybe you switch from breakout strategies to mean reversion in consolidation phases. Regular backtesting and performance reviews help ensure your approach stays relevant.
Common Pitfalls and How to Avoid Them in CFD Trading
Avoiding mistakes is just as important as mastering techniques. Many traders fail not because they lack skill, but because they fall into preventable traps.
Overleveraging and Poor Risk Management
This is the top reason for account blowups. New traders, lured by the promise of quick riches, often use excessive leverage without proper safeguards. Without stop-losses or position sizing, a small adverse move can erase weeks of gains. As highlighted by financial educators, leverage amplifies both gains and losses. Investopedia explains how leverage increases risk exposure, stressing that responsible use is critical. Always stick to your 1–2% risk rule, no matter how confident you feel.
Chasing Losses and Emotional Trading
After a losing streak, the urge to “get back” can lead to reckless trades—larger positions, ignored rules, or jumping into setups without confirmation. This emotional spiral usually deepens losses. The antidote? Discipline and detachment. Take a break, review your journal, and accept that losses are part of the process. Consistency over time beats short-term heroics.
Neglecting Backtesting and Continuous Learning
Jumping into live trading without testing a strategy is like flying blind. Backtesting—running your rules on historical data—helps verify if an edge exists. It also reveals flaws in logic or timing. Beyond that, markets evolve. What worked in 2020 may not work today. Stay current by reading market news, studying economic trends, and exploring new tools. Allocate time weekly for learning and refinement—it pays compound dividends.
Advanced Considerations and Unique Trading Rules
Beyond standard techniques, experienced traders often adopt guiding principles that promote discipline and capital preservation.
The 3-5-7 Rule, 5-3-1 Rule, and 90% Rule in Trading
These aren’t formal strategies, but mental frameworks used to reinforce sound habits.
- The 3-5-7 Rule: Sometimes interpreted as aiming for 5 units of profit for every 3 units of risk, with a maximum holding period of 7 periods. It emphasizes favorable risk-reward and time discipline.
- The 5-3-1 Rule: Could mean never risking more than 5% of capital, targeting 3x reward per risk, and using a 1% stop-loss. These are personal benchmarks that help maintain consistency.
- The 90% Rule: A sobering observation that 90% of traders lose 90% of their money within 90 days. While not statistically precise, it highlights the harsh reality of undisciplined trading. It serves as a wake-up call to prioritize education, planning, and risk control.
These aren’t rigid formulas, but reminders to stay humble, patient, and process-focused.
Conclusion: Your Path to Successful CFD Trading
Success in CFD trading doesn’t come from a single winning trade—it comes from consistent execution, continuous learning, and emotional resilience. Whether you lean toward rapid scalping or patient position trading, your strategy must be backed by solid risk management and a clear plan. Technical and fundamental analysis provide the tools, but discipline turns them into results. Build a detailed trading plan, keep a journal, and review your progress regularly. Stay adaptable, manage your emotions, and treat trading as a long-term skill to master. With the right mindset and methodology, you can navigate the complexities of CFDs and move steadily toward sustainable profitability.
What is the most profitable CFD trading strategy for beginners?
There isn’t a single “most profitable” strategy, especially for beginners. However, swing trading is often recommended for beginners because it requires less intense focus than scalping or day trading, allowing more time for analysis and decision-making. It still offers good profit potential by capturing medium-term trends without the need for constant screen monitoring.
How can I develop a reliable CFD trading plan?
A reliable CFD trading plan includes clear goals, specific entry/exit rules, strict risk management parameters (e.g., 1-2% risk per trade), position sizing guidelines, and a defined daily routine. It should also specify the markets you trade and the analytical tools you use. Regularly review and backtest your plan to ensure its effectiveness.
What are the essential risk management techniques for CFD trading?
Essential risk management techniques include:
- Setting stop-loss orders to limit potential losses.
- Using take-profit orders to lock in gains.
- Implementing proper position sizing based on your account equity and risk tolerance.
- Understanding and responsibly managing leverage and margin risks.
- Diversifying your trades.
These are crucial for capital preservation in leveraged trading.
Can technical indicators guarantee success in CFD trading?
No, technical indicators cannot guarantee success in CFD trading. They are tools that help analyze past price action and identify potential future movements, but they are not infallible. Market conditions can change rapidly, and indicators can give false signals. They are best used in conjunction with other forms of analysis, risk management, and a disciplined trading plan.
What is the difference between scalping, day trading, and swing trading in CFDs?
The main difference lies in the holding period and frequency of trades:
- Scalping: Trades held for seconds to minutes, aiming for very small, frequent profits.
- Day Trading: Trades opened and closed within the same day, focusing on intra-day price movements.
- Swing Trading: Trades held for several days to a few weeks, capturing medium-term price swings.
Each requires different levels of time commitment and psychological approach.
How does leverage affect CFD trading strategies?
Leverage allows you to control a larger position with a smaller amount of capital. While it can significantly magnify profits on winning trades, it equally amplifies losses on losing trades. This means a small adverse price movement can lead to substantial losses if not managed with strict stop-loss orders and appropriate position sizing. Leverage is a double-edged sword that demands careful risk management.
What common mistakes should CFD traders avoid?
Common mistakes include:
- Overleveraging and poor risk management.
- Emotional trading (e.g., fear, greed, chasing losses).
- Trading without a well-defined plan.
- Neglecting backtesting and continuous learning.
- Overtrading or taking too many positions simultaneously.
- Failing to adapt strategies to changing market conditions.
Are there any free CFD trading strategies available?
Yes, the fundamental principles behind many CFD trading strategies (like using moving averages, RSI, support/resistance, or basic price action patterns) are widely available for free through educational resources, financial blogs, and trading communities. However, the true value comes from how you adapt, test, and consistently apply these strategies within your own trading plan, rather than just knowing them.
What role does trading psychology play in successful CFD strategies?
Trading psychology plays a critical role. Emotions like fear, greed, and impulsivity can lead to irrational decisions, deviations from a trading plan, and ultimately, losses. Successful traders cultivate discipline, patience, objectivity, and emotional control, sticking to their pre-defined strategies even under pressure. A strong mental game is as important as a strong trading strategy.
How often should I review and adjust my CFD trading strategy?
You should review your CFD trading strategy regularly, ideally at least monthly or quarterly, and after any significant market events or changes in your trading performance. Market conditions are dynamic, so what worked previously might become less effective. Your review should involve analyzing your trading journal, backtesting adjustments, and adapting your strategy to remain relevant and effective.
留言