
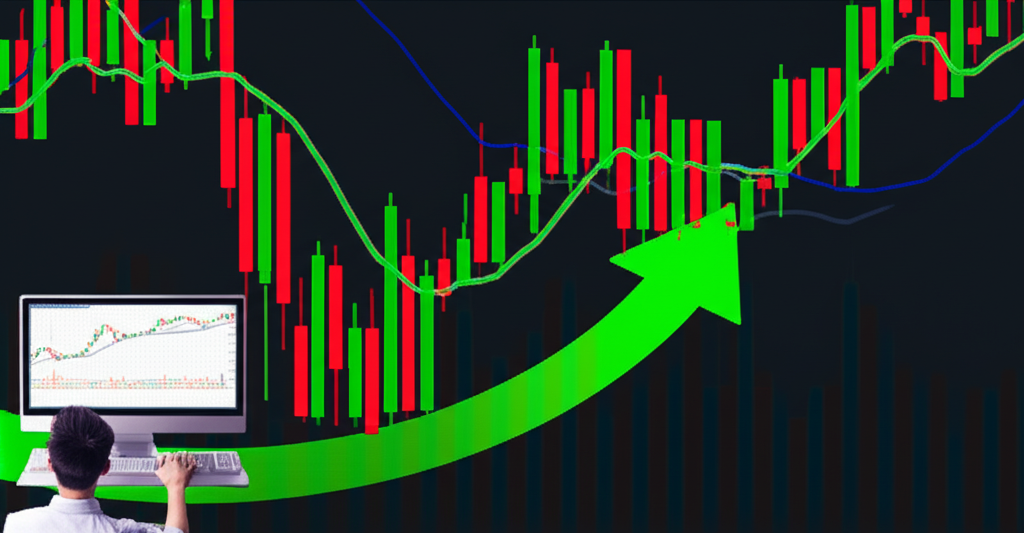
Introduction to Heikin Ashi Charts

Navigating financial markets often means sifting through volatile price swings that can obscure the bigger picture. Heikin Ashi charts were developed to address this challenge by offering a cleaner, more fluid visualization of market trends. Unlike standard candlesticks, which reflect raw price data, Heikin Ashi applies a smoothing mechanism that filters out minor fluctuations—commonly referred to as market noise—allowing traders to focus on sustained directional movement. The name itself, derived from Japanese, means “average bar,” highlighting its core function: transforming erratic price action into a coherent, flowing narrative. This charting method calculates each candle using a blend of current and prior period data, resulting in a visual representation that emphasizes momentum and trend continuity. Whether you’re analyzing forex, equities, or commodities, Heikin Ashi can simplify the process of identifying bullish strength, bearish dominance, or periods of consolidation. In this comprehensive guide, we’ll break down how Heikin Ashi works, how to interpret its signals, and how to integrate it effectively into real-world trading strategies—while also addressing its accuracy, adoption among professionals, and customization options across platforms.
What is Heikin Ashi? A Clear Definition
At its core, Heikin Ashi is a modified candlestick technique designed to enhance trend clarity. While traditional candlesticks plot the actual open, high, low, and close prices for each time period, Heikin Ashi uses a recalculated formula based on averaged values. This adjustment smooths the chart’s appearance, reducing the visual clutter caused by small, insignificant price reversals. The result? A cleaner, more intuitive display of market direction. Instead of reacting to every minor pullback, traders gain a better sense of whether the overall momentum is building, weakening, or shifting. Each new Heikin Ashi candle depends not only on current price action but also on the previous candle’s values, creating a connected sequence that reinforces trend persistence. This interdependence helps highlight sustained moves—whether upward or downward—and makes it easier to distinguish between genuine momentum and random volatility. Because of this design, Heikin Ashi is particularly useful for traders who prioritize trend-following strategies and want to avoid being misled by short-term market noise.
The Mechanics Behind Heikin Ashi: Calculation and Formula

To truly grasp the value of Heikin Ashi, it’s essential to understand how its candles are constructed. Unlike traditional candlesticks that rely solely on real-time price data, Heikin Ashi incorporates historical information into its calculations, creating a delayed but smoother depiction of market behavior. The formula consists of four components—each derived differently than in standard charting:
– **HA-Close** = (Open + High + Low + Close) / 4
This represents the average price of the current period’s traditional candle, acting as the foundation for the rest of the calculation.
– **HA-Open** = (Previous HA-Open + Previous HA-Close) / 2
Instead of using the actual open price, Heikin Ashi takes the midpoint of the prior candle’s open and close, linking each new candle to the past.
– **HA-High** = Maximum of (Current Traditional High, HA-Open, HA-Close)
This ensures the high point reflects the highest value among the real high and the calculated HA-Open and HA-Close.
– **HA-Low** = Minimum of (Current Traditional Low, HA-Open, HA-Close)
Similarly, the low captures the lowest of the three values, ensuring alignment with the smoothed structure.
Because of this averaging process, the highs and lows on a Heikin Ashi chart may not match those on a traditional chart. This trade-off enhances visual clarity but sacrifices precision—meaning traders shouldn’t rely on Heikin Ashi alone for exact entry or exit levels. For a deeper dive into its mechanics, Investopedia offers a detailed explanation available here.
Step-by-Step Heikin Ashi Calculation Example
Let’s walk through a practical example to see how these formulas come together.
Assume the following data:
– **Previous Heikin Ashi Candle:** HA-Open = 100, HA-Close = 105
– **Current Traditional Candle:** Open = 103, High = 108, Low = 102, Close = 107
Now apply the formulas:
1. **HA-Close** = (103 + 108 + 102 + 107) / 4 = 420 / 4 = **105**
This is the average of the current period’s actual prices.
2. **HA-Open** = (100 + 105) / 2 = **102.5**
Derived from the midpoint of the previous Heikin Ashi candle.
3. **HA-High** = Max(108, 102.5, 105) = **108**
The highest value among the real high and the two calculated prices.
4. **HA-Low** = Min(102, 102.5, 105) = **102**
The lowest of the three possible values.
The resulting Heikin Ashi candle has: Open = 102.5, High = 108, Low = 102, Close = 105. Notice how the open doesn’t match the actual open price (103), and the body reflects an averaged reality. This example illustrates the core concept: Heikin Ashi creates a narrative of momentum rather than recording exact price ticks.
Interpreting Heikin Ashi Charts: Reading Trends and Reversals
Interpreting Heikin Ashi charts revolves around recognizing visual patterns in candle color, body size, and wick length. These elements combine to form a language of momentum and potential change.
– **Strong Bullish Trend:** A sequence of green (or hollow) candles with minimal or no lower wicks and large real bodies signals strong buying pressure. The absence of lower shadows indicates that prices consistently moved higher throughout the period, with little to no selling resistance.
– **Strong Bearish Trend:** Red (or filled) candles dominate during downtrends, especially when they lack upper wicks and have elongated bodies. This pattern shows sellers in control, pushing prices down without significant pushback.
– **Market Indecision or Consolidation:** When candles shrink in size and develop long upper and lower wicks, it suggests a balance between buyers and sellers. These formations resemble Doji or Spinning Top patterns and often appear at turning points or during sideways phases.
– **Potential Reversals:** A shift in candle color—especially after a prolonged trend—can signal a change in sentiment. For instance, a string of red candles followed by a green one, particularly if it has a strong body and no upper wick, may indicate a bullish reversal. However, confirmation from subsequent candles or other indicators strengthens the signal.
By focusing on these cues, traders can make more confident decisions about entering, holding, or exiting positions based on the underlying strength of the trend.
Key Heikin Ashi Candlestick Patterns and Their Meanings
Although Heikin Ashi doesn’t support traditional candlestick patterns in the same way as standard charts, certain configurations carry significant meaning:
– **Long Green Candles Without Lower Wicks:** These are among the strongest bullish signals. They suggest unwavering demand, where buyers absorb all sell orders and push prices higher. Traders often interpret this as a green light to stay long or enter new bullish positions.
– **Long Red Candles Without Upper Wicks:** The bearish counterpart, indicating aggressive selling. These candles reflect strong supply overcoming demand, signaling continued downside potential.
– **Small-Bodied Candles with Long Wicks:** Often appearing after extended moves, these candles point to exhaustion. The long wicks show price rejection in both directions, hinting that the current trend may be losing steam.
– **Color Change After a Strong Trend:** A reversal in candle color—green after red, or vice versa—can mark a shift in control. While not definitive on its own, it warrants closer attention, especially when supported by volume or confluence with key technical levels.
– **Stair-Stepping Formation:** In healthy trends, Heikin Ashi candles often form a staircase-like pattern, where each new candle opens near the midpoint of the prior one. This rhythm reflects steady progression and reinforces confidence in the trend’s durability.
These patterns offer traders a simplified yet powerful way to assess market dynamics without getting lost in noise.
Heikin Ashi vs. Traditional Candlesticks: A Head-to-Head Comparison
Understanding the contrast between Heikin Ashi and traditional candlesticks is crucial for choosing the right tool at the right time.
| Feature | Heikin Ashi Candlesticks | Traditional Candlesticks |
| :—————— | :—————————————————– | :———————————————————- |
| **Calculation** | Averaged prices (current and previous candle data) | Actual Open, High, Low, Close prices of the current period |
| **Appearance** | Smoothed, less choppy, clearer trend visualization | Jagged, reflects every price movement, more market noise |
| **Signal Clarity** | Excellent for trend identification and momentum | Shows precise price action, including gaps and exact highs/lows |
| **Lag** | Inherent lag due to averaging, signals can be delayed | No lag, shows real-time price action |
| **Price Gaps** | Do not display price gaps | Clearly show price gaps |
| **False Signals** | Reduces false signals during choppy markets | More prone to false signals from minor fluctuations |
| **Reversals** | Easier to spot through color changes and small bodies | Identified through complex patterns (e.g., engulfing, hammer) |
| **Data Integrity** | Does not show actual OHLC prices for the period | Displays exact OHLC prices for the period |
Heikin Ashi excels in environments where noise obscures direction—such as volatile forex pairs or trending stocks. However, its smoothing effect comes at a cost: delayed signals and obscured price details. Traditional candlesticks remain indispensable for strategies requiring precision, such as scalping, gap trading, or identifying exact support and resistance levels. The most effective traders often use both—leveraging Heikin Ashi for directional bias and traditional charts for execution.
The Advantages of Using Heikin Ashi in Trading
Integrating Heikin Ashi into your analysis offers several strategic benefits:
– **Enhanced Trend Recognition:** The smoothed visuals make it easy to distinguish between a true trend and random volatility. Long sequences of same-colored candles with minimal wicks provide clear confirmation of directional strength.
– **Noise Reduction:** By filtering out minor price swings, Heikin Ashi helps traders avoid overreacting to temporary pullbacks or spikes. This leads to fewer whipsaws and more consistent trade management.
– **Visual Momentum Assessment:** Large-bodied candles signal strong momentum, while shrinking bodies and growing wicks suggest weakening force. This allows for dynamic adjustments to position sizing or stop placement.
– **Psychological Edge:** The calmer appearance of Heikin Ashi charts can reduce emotional stress during volatile periods. Traders are less likely to panic-sell during a pullback when the Heikin Ashi candle remains green and intact.
– **Ideal for Swing and Position Trading:** Since these styles focus on capturing larger moves over days or weeks, the slight lag in Heikin Ashi signals is less of a drawback. Instead, the emphasis on trend persistence aligns perfectly with longer-term strategies.
Used wisely, Heikin Ashi acts as a mental filter—helping traders see the forest through the trees.
Limitations and Disadvantages of Heikin Ashi
Despite its strengths, Heikin Ashi is not without drawbacks. Traders must be aware of its constraints to avoid costly misinterpretations:
– **Signal Lag:** Because each candle depends on prior values, Heikin Ashi reacts slower than traditional charts. This delay can result in missed entries or late exits, especially in fast-moving markets.
– **Loss of Exact Price Data:** The averaged values mean you can’t rely on Heikin Ashi to identify precise support/resistance levels, set accurate stop-loss orders, or measure exact price targets. For these tasks, traditional charts are essential.
– **No Price Gaps:** Gaps—important signals of sentiment shifts or news impact—are absent on Heikin Ashi charts. This can cause traders to overlook critical market events visible on standard candlesticks.
– **Whipsaws in Choppy Markets:** In range-bound conditions, Heikin Ashi may produce alternating colors that mimic trends, leading to false breakouts and losing trades if used in isolation.
– **Unsuitable for Scalping:** High-frequency traders need immediate feedback and exact price levels—neither of which Heikin Ashi provides. Its smoothing effect works against the precision required in scalping strategies.
Recognizing these limitations ensures Heikin Ashi is used as a complement—not a replacement—for other analytical tools.
Heikin Ashi Trading Strategies: From Basic to Advanced
Heikin Ashi shines when integrated into structured trading approaches. Below are strategies ranging from simple to sophisticated.
Simple Trend Following with Heikin Ashi
This foundational strategy leverages the chart’s ability to highlight directional bias:
– **Long Entry:** Initiate a buy when Heikin Ashi candles turn green and display small or no lower wicks. Maintain the position as long as the candles remain green and momentum appears intact.
– **Short Entry:** Enter a sell trade when candles shift to red with minimal upper wicks, indicating strong bearish momentum. Hold while the downtrend persists.
– **Exit Rules:**
– **Loss of Momentum:** Close or reduce exposure when candle bodies shrink and opposing wicks grow—e.g., upper wicks in an uptrend.
– **Color Reversal:** Exit fully when the candle color flips against your position, signaling a potential trend shift.
This approach helps traders ride trends longer and avoid being shaken out by minor countertrends.
Combining Heikin Ashi with Other Indicators (e.g., Moving Averages, RSI)
To increase signal reliability, pairing Heikin Ashi with confirming indicators is highly effective:
– **With Moving Averages:** Use a short-term EMA (like 9-period) and a longer SMA (like 50-period).
– **Buy Signal:** Heikin Ashi turns green *and* the short MA crosses above the long MA.
– **Sell Signal:** Heikin Ashi turns red *and* the short MA crosses below the long MA.
This dual confirmation reduces false signals and strengthens trend validity.
– **With RSI:** The Relative Strength Index adds context to overbought or oversold conditions.
– **Buy Setup:** Green Heikin Ashi candles form while RSI rises from below 30 (oversold) or remains in bullish territory.
– **Sell Setup:** Red candles align with RSI falling from above 70 (overbought).
– **Divergence:** If Heikin Ashi makes a higher high but RSI makes a lower high, it may foreshadow a bearish reversal—even if candles are still green.
These combinations create a more robust decision-making framework.
Advanced Heikin Ashi Reversal Strategies
While primarily trend-following, Heikin Ashi can also aid in spotting reversals when used with additional tools:
– **Doji at Key Levels:** Small-bodied candles with long wicks at major support or resistance zones suggest indecision. When combined with a prior strong trend, this pattern can signal an impending reversal.
– **Volume Confirmation:** A color change supported by rising volume adds credibility. For example, a shift from red to green candles on expanding volume suggests institutional buying interest.
– **Higher Timeframe Divergence:** Monitor Heikin Ashi on daily or weekly charts alongside oscillators like MACD. If price makes a higher high but MACD shows a lower high, bearish divergence may be forming—warning of a reversal before the Heikin Ashi color changes.
– **Trendline Breaks:** Draw trendlines directly on the Heikin Ashi chart. A break accompanied by a color change and follow-through candles confirms a meaningful shift in momentum.
These advanced techniques allow traders to anticipate reversals before they fully materialize.
Beyond the Basics: Accuracy, Professional Use, and Customization
Moving beyond mechanics, it’s important to assess Heikin Ashi’s real-world effectiveness and how it fits into broader trading ecosystems.
How Accurate is Heikin Ashi? An Objective Look at Its Reliability
Heikin Ashi isn’t designed to predict exact turning points—it’s built to clarify direction. In that role, it performs exceptionally well. When a series of green candles with no lower wicks appears, it reliably reflects strong bullish momentum. However, its lag means it often confirms trends after they’ve begun, making it less effective for catching the very start of a move. Research from the National Bureau of Economic Research suggests that technical indicators tend to perform better when combined rather than used in isolation. This principle applies directly to Heikin Ashi: its accuracy improves significantly when validated with volume, momentum oscillators, or price action from traditional charts. Used alone, it risks generating late signals or false reversals in sideways markets.
Do Professional Traders Use Heikin Ashi? Insights from the Pros
Adoption among institutional traders varies. While few rely on it for execution, many use it as a secondary tool:
– **For Macro Analysis:** Portfolio managers and macro traders may review Heikin Ashi charts on weekly or monthly timeframes to confirm long-term trends without distraction from daily volatility.
– **As a Confirmation Tool:** Some professionals overlay Heikin Ashi on traditional charts to validate momentum. For example, if a stock breaks above resistance but Heikin Ashi remains red, it may suggest weak follow-through.
– **Not for High-Frequency Trading:** Algorithms and scalpers avoid Heikin Ashi due to its lag and lack of real-time fidelity. Their strategies depend on millisecond-level data and exact price points.
– **Psychological Utility:** Even seasoned traders face emotional pressure during drawdowns. Heikin Ashi’s smooth visuals can help them stay committed to their strategy during choppy phases.
In short, Heikin Ashi occupies a niche—not as a primary tool, but as a valuable supplement for trend confirmation and emotional discipline.
The “Heikin Ashi 5 Rule” and Other Specific Trading Rules
While not an official standard, the “Heikin Ashi 5 Rule” refers to a popular trend-confirmation tactic:
– **Bullish Entry:** Wait for five consecutive green candles with no lower wicks. Enter long on the sixth candle’s open.
– **Bearish Entry:** Wait for five red candles with no upper wicks. Enter short on the sixth candle.
This rule aims to filter out weak trends and only engage when momentum is clearly established. However, it can lead to late entries in fast markets.
More widely applicable rules include:
– **Trade with the Dominant Color:** Only take trades in the direction of the prevailing Heikin Ashi trend.
– **Exit on Color Change:** Close positions when the candle color flips.
– **Watch for Small Bodies and Long Wicks:** These often precede reversals.
– **Combine with Traditional Support/Resistance:** Use price levels from standard charts to time entries when Heikin Ashi shows reversal patterns.
These guidelines help structure decision-making and reduce emotional interference.
Customizing Heikin Ashi Indicators: Advanced Settings and Platforms
Most modern platforms support Heikin Ashi with varying degrees of customization:
– **TradingView:** Offers Heikin Ashi as a chart type. Users can switch instantly and layer indicators like moving averages or volume. Advanced traders can write custom Pine Script strategies that respond to Heikin Ashi patterns, such as alerts for color changes or wick thresholds. Detailed guidance is available on their support site.
– **Thinkorswim:** Allows selection of Heikin Ashi from the chart style menu. Its thinkScript language enables creation of custom studies—for example, scanning for stocks with 10 consecutive green Heikin Ashi candles.
– **MetaTrader 4/5:** Heikin Ashi is available as a custom indicator. Traders can download scripts or code their own, often adding alert functions or integrating with Expert Advisors for automation.
– **NinjaTrader:** Supports Heikin Ashi as a built-in chart style. Its C#-based NinjaScript allows deep integration, enabling algorithmic strategies that use smoothed signals for trend filtering.
Customization typically involves combining Heikin Ashi with alerts, filters, or automated execution logic to enhance its utility.
Is Heikin Ashi Useful for Beginners? Getting Started Safely
For new traders, Heikin Ashi can be a game-changer. Its clean visuals make it easier to grasp trend direction without getting overwhelmed by volatility. However, beginners must approach it with caution:
– It lags behind real price action, so entries may feel delayed.
– It doesn’t show true highs and lows, making precise risk management challenging.
– It should never be used in isolation.
**Recommended Steps for Beginners:**
1. **Start with Higher Timeframes:** Use daily or 4-hour charts to study major trends. Avoid 1-minute or 5-minute charts initially.
2. **Learn Support and Resistance on Traditional Charts:** Identify key levels using standard candlesticks, then switch to Heikin Ashi for trend confirmation.
3. **Add a Moving Average:** Only trade in the direction where Heikin Ashi and a 20-period MA agree.
4. **Practice on a Demo Account:** Test strategies risk-free before going live.
5. **Use Traditional Charts for Stops and Targets:** Set stop-loss and take-profit levels based on actual price structure, not Heikin Ashi values.
6. **Understand the Trade-Offs:** Know that smoothing comes at the cost of precision.
By following these steps, newcomers can harness Heikin Ashi’s clarity while avoiding its pitfalls.
Conclusion: Maximizing Your Trading Edge with Heikin Ashi
Heikin Ashi charts transform noisy, erratic price data into a streamlined view of market momentum. By averaging price inputs and linking candles across time, they offer a powerful lens for identifying trends, assessing strength, and filtering distractions. While they introduce lag and obscure exact price points, these trade-offs are minor when Heikin Ashi is used as part of a broader strategy. Whether you’re a beginner seeking clarity or an experienced trader looking to confirm directional bias, Heikin Ashi adds value when combined with traditional analysis, volume, and disciplined risk management. Its true power lies not in replacing standard tools, but in enhancing them—helping traders stay focused, make informed decisions, and navigate markets with greater confidence.
How accurate is Heikin-Ashi for predicting market movements?
Heikin Ashi is highly accurate for identifying and visualizing trends by smoothing out market noise. However, due to its averaged calculation, it has a lagging nature and does not predict precise market turning points as effectively as real-time price action. Its predictive power is best when combined with other indicators and analysis methods.
What is the “Heikin-Ashi 5 rule” and how is it applied in trading?
The “Heikin-Ashi 5 rule” typically refers to a strategy where a trader waits for 5 consecutive Heikin Ashi candles of the same color (e.g., 5 green candles for a buy signal) before entering a trade. It aims to confirm an established trend before taking a position, but it’s a simplified rule that may lead to delayed entries.
Do professional traders commonly use Heikin-Ashi charts in their analysis?
Professional traders may use Heikin Ashi as a complementary tool, especially for identifying macro trends on higher timeframes or for managing the psychological impact of volatility. However, for precise execution, scalping, or algorithmic trading, most professionals prefer traditional candlesticks due to their unfiltered, real-time price data.
Is Heikin-Ashi a suitable charting method for beginners in trading?
Yes, Heikin Ashi can be very suitable for beginners due to its ability to simplify trend identification and reduce market noise. However, beginners must be aware of its lagging signals and loss of precise price data. It’s recommended to combine it with basic support/resistance and other indicators, and to practice extensively on a demo account.
What is the main difference between Heikin Ashi and traditional Japanese candlesticks?
The main difference lies in their calculation: Traditional candlesticks display the actual open, high, low, and close prices for a period, showing exact price action and gaps. Heikin Ashi candles are calculated using averaged prices from both the current and previous periods, which smooths out market noise but results in a slight lag and does not show precise price points or gaps.
How do you calculate the Open, High, Low, and Close for a Heikin Ashi candle?
- **HA-Close:** (Current Traditional Open + High + Low + Close) / 4
- **HA-Open:** (Previous HA-Open + Previous HA-Close) / 2
- **HA-High:** Max(Current Traditional High, Current HA-Open, Current HA-Close)
- **HA-Low:** Min(Current Traditional Low, Current HA-Open, Current HA-Close)
Can Heikin Ashi be effectively used for day trading strategies?
Heikin Ashi can be used for day trading, especially for identifying intraday trends on slightly higher timeframes (e.g., 15-minute or 30-minute charts). However, its lagging nature and lack of precise price points make it less ideal for very short-term, high-frequency day trading or scalping strategies that require immediate, unfiltered price action.
What are the best technical indicators to combine with Heikin Ashi for stronger signals?
Effective combinations include:
- **Moving Averages (MAs):** To confirm trend direction and identify dynamic support/resistance.
- **Relative Strength Index (RSI):** To gauge momentum and identify overbought/oversold conditions or divergence.
- **MACD:** To confirm trend strength and potential reversals through crossovers and divergence.
- **Volume:** To validate the strength of price moves and trend changes indicated by Heikin Ashi.
Where can I find Heikin Ashi charts and indicators (e.g., on TradingView or other platforms)?
Heikin Ashi charts are widely available on most popular trading platforms. On platforms like TradingView, Thinkorswim, MetaTrader 4/5, and NinjaTrader, you can typically find Heikin Ashi as a selectable chart type or a built-in indicator in the chart settings or indicator library.
Are there recommended Heikin Ashi books or advanced resources for further learning?
While there aren’t many dedicated books solely on Heikin Ashi, it’s often covered in comprehensive technical analysis guides. For advanced learning, focus on resources that delve into combining Heikin Ashi with other indicators, multi-timeframe analysis, and sophisticated trading strategies. Online trading education platforms, broker educational sections, and communities like TradingView often offer valuable insights and user-generated strategies.
留言