Introduction: What is Trend Following and Why Does It Matter?

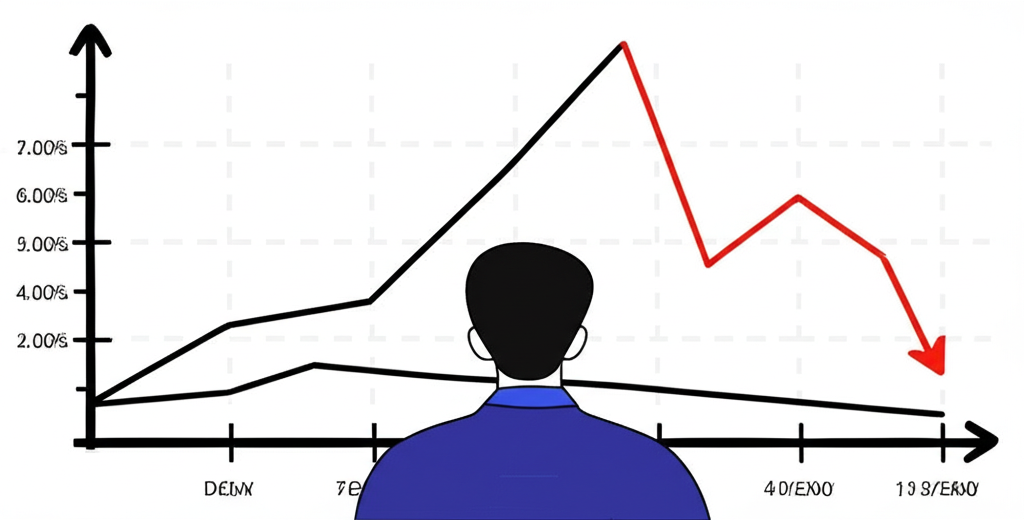
Trend following is more than just a trading method—it’s a philosophy rooted in market behavior. Rather than attempting to forecast where prices are headed, trend followers focus on responding to what the market is already doing. The core idea is simple: when an asset begins to move, whether upward or downward, it often continues in that direction for a sustained period. This strategy capitalizes on those directional moves by entering positions once a trend is confirmed, holding through its progression, and exiting only when clear signals suggest a reversal.
In today’s fast-moving and often unpredictable markets, this approach offers a structured alternative to emotional decision-making. By relying on objective rules instead of predictions, trend following removes much of the guesswork and psychological bias that can derail investors. It’s particularly valuable during volatile periods—times when traditional portfolios suffer, but trend-following systems may thrive by capturing sharp, sustained moves in either direction. Used widely by hedge funds, commodity trading advisors (CTAs), and independent traders alike, it has proven to be a resilient method across asset classes and economic cycles.
The Core Principles of Trend Following

At its foundation, trend following operates on a set of clear, repeatable principles designed to navigate uncertainty with consistency. Unlike discretionary trading, which can be swayed by emotion or intuition, this strategy emphasizes structure, adaptability, and above all, risk control.
Identifying and Riding Market Trends
The central goal of any trend-following system is to detect persistent price movements and stay engaged as long as the momentum lasts. Markets don’t move in straight lines, but they often exhibit recognizable patterns—such as a series of higher highs and higher lows in an uptrend, or lower highs and lower lows in a downtrend. These sequences signal directional strength and form the basis for trade entries.
Trend followers aren’t concerned with catching the absolute bottom or top of a move. Instead, they accept a delay in entry—waiting for confirmation—because early identification isn’t the priority; staying in winning trades is. This patience allows them to avoid false starts while positioning themselves to benefit from major market waves. Whether markets surge or collapse, the objective remains the same: align with the dominant direction and let profits grow until evidence suggests the trend has ended.
Systematic Decision Making and Risk Management
One of the most powerful advantages of trend following lies in its rule-based framework. Every action—from entering a trade to sizing positions and setting exits—is predetermined. This eliminates impulsive decisions driven by fear or greed, two forces that frequently undermine investor performance.
Because not every trade will be profitable, managing downside risk is critical. Trend followers expect losses and design their systems around that reality. Stop-loss orders are built into every position, ensuring that no single losing trade can inflict severe damage. Position sizing is calculated based on volatility and account size, so losses remain proportional and manageable. This disciplined approach enables traders to survive extended drawdowns and remain active when large, profitable trends finally emerge.
Key Technical Indicators for Trend Following Strategies

To translate market data into actionable signals, trend followers rely on technical indicators. These tools help filter noise, confirm trends, and guide risk management decisions—all essential for maintaining a consistent edge.
Moving Averages (MAs)
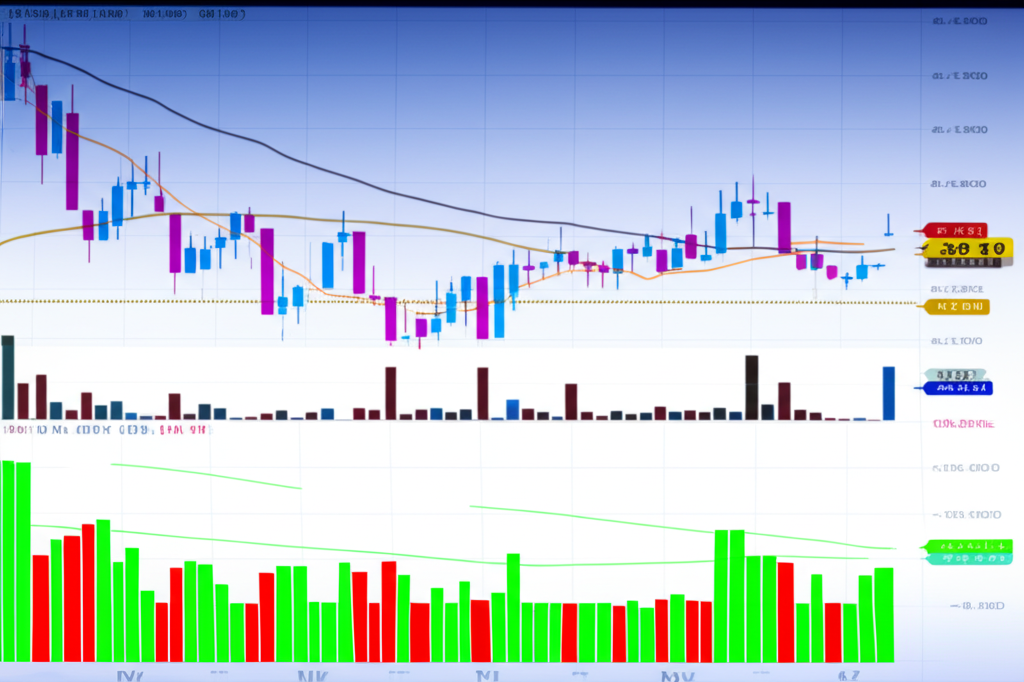
Moving averages are foundational in trend identification. By smoothing out price fluctuations over time, they reveal the underlying direction of the market. The Simple Moving Average (SMA) calculates the average closing price over a specified window, offering a clear view of momentum. The Exponential Moving Average (EMA) places greater weight on recent prices, making it more responsive to new trends.
A popular technique involves using crossovers between short- and long-term moving averages. For instance, when the 50-day EMA rises above the 200-day EMA—a pattern known as the “golden cross”—it often signals the start of an uptrend. Conversely, when the shorter average drops below the longer one, referred to as a “death cross,” it may indicate a bearish shift. While these signals aren’t foolproof, they provide a systematic way to time entries and exits.
Average True Range (ATR)
While moving averages highlight direction, the Average True Range (ATR) measures volatility. Developed by J. Welles Wilder, ATR calculates the average range between high and low prices over a given period, helping traders understand how much an asset typically moves in a day.
This insight is crucial for risk management. A common practice is to set stop-loss levels at a multiple of the ATR—say, two or three times its value—away from the entry point. This ensures that stops are wide enough to withstand normal price swings without being triggered by random noise, yet tight enough to limit exposure. As volatility changes, so does the stop, creating a dynamic defense mechanism that adapts to current market conditions.
Other Momentum and Volatility Indicators
Beyond moving averages and ATR, several complementary indicators enhance trend-following systems:
– **Moving Average Convergence Divergence (MACD):** This momentum oscillator tracks the relationship between two EMAs. When the MACD line crosses above the signal line, it can signal bullish momentum; a cross below suggests bearish pressure. Divergences between MACD and price can also warn of weakening trends.
– **Relative Strength Index (RSI):** Though often used to spot overbought or oversold conditions, RSI can help identify potential exhaustion points in strong trends. However, in persistent trends, assets can remain overbought or oversold for extended periods, so RSI works best when combined with trend confirmation tools.
– **Average Directional Index (ADX):** Unlike most indicators, ADX doesn’t show direction—it measures trend strength. Values above 25 generally indicate a strong trend, while readings below 20 suggest a range-bound market. This helps traders decide whether to engage or stand aside.
– **Bollinger Bands:** These consist of a middle SMA flanked by upper and lower bands set at two standard deviations. When price touches or breaks through the outer bands, it may signal continuation or reversal, depending on context. In trending environments, price often “rides” the bands, providing visual confirmation of momentum.
Building a Trend Following Strategy: Components and Examples

A successful trend-following system isn’t built on intuition—it’s engineered like a machine, with each component precisely defined and tested. The key is not just spotting trends, but managing every phase of a trade systematically.
Entry Signals and Breakout Strategies
One of the most effective ways to enter a trend is through breakouts—when price moves beyond a well-established level of resistance (for longs) or support (for shorts). These breaks suggest that supply and demand have shifted decisively, potentially marking the start of a new directional phase.
Donchian Channels are a classic tool for identifying such opportunities. By plotting the highest high and lowest low over a set number of periods—commonly 20 or 55 days—traders can define breakout thresholds. A buy signal is triggered when price exceeds the upper channel; a sell signal occurs when it falls below the lower band. This method, famously used by the original Turtle Traders in the 1980s, relies purely on price action and requires no forecasting.
Another widely used approach involves trading new 52-week highs or lows. The logic is straightforward: assets making fresh all-time highs often continue rising due to momentum and institutional buying. Similarly, those hitting new lows may keep falling as selling pressure builds. This strategy taps into the persistence of momentum across equities, futures, and forex markets.
Exit Signals and Trailing Stops
Knowing when to exit is just as important as knowing when to enter. Trend followers aim to stay in winning trades as long as possible while protecting against sudden reversals. Fixed profit targets, though common in other strategies, are generally avoided—because trends can last longer than expected.
Instead, trailing stops are the preferred tool. A percentage-based trailing stop, such as 15%, adjusts upward as the price rises, locking in gains automatically. More sophisticated versions use volatility metrics: an ATR-based trailing stop might trail the highest price by 3x the current ATR, allowing room for normal fluctuations while cutting losses quickly if momentum reverses.
Other exit rules include moving average reversals—exiting a long trade when price closes below a key MA—or using ADX to detect fading trend strength. The goal is always the same: preserve capital during reversals and let winners run until the trend clearly ends.
Position Sizing and Capital Allocation
Even the best strategy fails without proper position sizing. This determines how much to invest per trade based on risk tolerance and account size. Without discipline here, a few losing trades can wipe out months of gains.
The fixed fractional method allocates a consistent percentage of equity—typically 1% to 2%—to each trade’s maximum risk. For example, in a $100,000 account risking 1% per trade, $1,000 is the maximum allowable loss. If the stop-loss is $5 away from entry, the trader would buy 200 shares ($1,000 ÷ $5). This keeps risk proportional regardless of market conditions.
Volatility-adjusted sizing takes this further by scaling position size according to ATR. A stock with high volatility gets a smaller position than a stable one, ensuring that each trade carries roughly the same dollar risk. Combined with diversification across uncorrelated assets—such as commodities, bonds, currencies, and global equities—this method smooths returns and reduces portfolio volatility over time.
The Performance of Trend Following: Historical Context and Empirical Evidence
Trend following isn’t a theoretical concept—it’s a strategy with a documented track record spanning decades. Its performance has been validated not only through real-world trading but also through rigorous academic analysis.
Historically, CTAs employing systematic trend-following models have delivered positive returns across diverse futures markets, including crude oil, gold, Treasury bonds, stock indices, and foreign exchange. What makes this strategy particularly compelling is its behavior during crises. When equities plummet during recessions or geopolitical shocks, trend followers can profit by shorting falling markets or going long in safe-haven assets.
Research from firms like AQR Capital Management underscores this resilience. Their studies show that trend-following strategies have generated positive risk-adjusted returns over long periods, with returns uncorrelated to traditional asset classes. Notably, these strategies tend to shine during extreme market events—like the 2008 financial crisis or the 2020 pandemic crash—precisely when investors need protection the most. AQR’s research on trend following highlights its century-long efficacy and unique return profile, suggesting that trend persistence is a structural feature of financial markets rather than a fleeting anomaly.
Challenges and Realities of Trend Following: The “Painful Journey”
Despite its potential, trend following is not for the faint of heart. It demands patience, discipline, and emotional fortitude—qualities that are tested repeatedly throughout the investing cycle.
Drawdowns and Whipsaws
Trend-following systems experience frequent small losses. In sideways or choppy markets, prices oscillate without forming clear trends, causing repeated false signals. These “whipsaws” lead to entries that quickly reverse, triggering stop-losses. Over time, these losses accumulate, resulting in drawdowns—periods where account equity falls from its peak.
These drawdowns can last months or even years, especially during prolonged consolidation phases. But they’re an accepted cost of doing business. The strategy is designed around the idea that a few large, well-riding trends will outweigh many small losses. Surviving the lean periods is essential to being in place when the next big move begins.
The Psychological Demands of Discipline
The real challenge isn’t technical—it’s psychological. During flat markets, trend followers face boredom and self-doubt. Seeing other strategies outperform can create temptation to abandon the system or tweak rules midstream. Yet consistency is the cornerstone of success.
As Alpha Architect eloquently describes it, the pain comes from persisting with a strategy that feels wrong in the short term but pays off over the long haul. Fear can cause early exits from winning trades; greed can lead to overbetting after a string of wins. Only those who commit fully to the process—accepting losses as part of the game—can reap the rewards.
Market Regimes and Adaptability
No strategy works equally well in all environments. Trend following excels in strongly trending markets but struggles when prices move sideways. Recognizing that market regimes shift—between trending, volatile, and range-bound phases—is key to managing expectations.
Diversification helps mitigate this issue. By applying the strategy across dozens of global markets and multiple timeframes, trend followers increase the odds that some portion of the portfolio is always engaged in a profitable trend. Still, no system is immune to unfavorable conditions. The goal isn’t perfection—it’s durability over decades.
Advanced Considerations and Institutional Perspectives
Sophisticated trend followers go beyond basic rules, incorporating institutional-grade enhancements to improve consistency and scalability.
Diversification Across Markets and Timeframes
Top-performing systems don’t rely on a single market or timeframe. They trade across equities, fixed income, currencies, energy, metals, and agricultural commodities—many of which move independently. This broad exposure ensures that even if some sectors are stagnant, others may be trending strongly.
Additionally, blending short-, medium-, and long-term signals allows capture of different market cycles. Short-term models react quickly to emerging moves; long-term models stay invested in multi-year trends. Combining them reduces dependency on any single signal and creates a smoother equity curve.
Quantifying the “Fat Right Tail” Phenomenon
One of the most distinctive features of trend-following returns is the “fat right tail”—a statistical term meaning that extremely positive outcomes occur more frequently than a normal distribution would predict. While losses are typically small and frequent, gains can be massive and explosive during major market dislocations.
These outlier wins—such as capturing the entire 2008 bear market or the 2020 V-shaped recovery—can account for the majority of long-term profits. Understanding this asymmetry is crucial: it justifies enduring periods of underperformance in anticipation of rare but transformative gains. This dynamic is central to how many quantitative hedge funds generate alpha over time.
Beyond Basic Indicators: Algorithmic Approaches and Machine Learning
While traditional tools remain effective, modern trend following increasingly leverages algorithmic execution and data science. Automated systems can scan hundreds of markets in real time, execute trades instantly, and rebalance portfolios without human intervention.
Machine learning is being explored to detect subtle trend patterns, optimize parameter settings dynamically, or identify regime shifts before they become obvious. While not a replacement for core principles, these technologies enhance signal accuracy and adaptability.
For developers and quants, platforms like TradingView (with Pine Script), MetaTrader (MQL), and Python (using Pandas, NumPy, and Scikit-learn) offer powerful environments for building, testing, and deploying strategies. This fusion of old-school discipline with cutting-edge technology defines the next generation of systematic trading.
Conclusion: Embracing the Trend for Long-Term Success
Trend following stands apart as a disciplined, evidence-backed approach to investing. It doesn’t promise quick wins or perfect timing—it offers something more valuable: consistency in the face of uncertainty. By aligning with market momentum, managing risk rigorously, and adhering to predefined rules, investors can position themselves to benefit from the most powerful moves in financial history.
Yes, the path includes discomfort—drawdowns, false signals, and long stretches of underperformance. But embedded within those challenges is the potential for outsized rewards. Supported by historical data, academic research, and decades of real-world application, trend following remains a vital tool for building resilient, diversified portfolios. Success doesn’t come from predicting the future—it comes from reacting wisely to what the market reveals, one trend at a time.
Frequently Asked Questions About Trend Following Strategies
1. Does trend-following really work, and what evidence supports its efficacy?
Yes, trend following has a well-documented history of working across various asset classes for over a century. Evidence comes from academic studies, historical backtests, and the sustained success of Commodity Trading Advisors (CTAs) and quantitative hedge funds. These studies often highlight its ability to generate positive returns and provide diversification benefits, particularly during periods of market turmoil.
2. What are the essential components required to build a robust trend following strategy?
A robust trend following strategy typically requires:
- **Trend Identification:** Rules for

留言