

What is MACD? Understanding the Moving Average Convergence Divergence
The Moving Average Convergence Divergence, commonly known as MACD, is a cornerstone of technical analysis in modern trading. Designed by Gerald Appel in the late 1970s, this momentum-based indicator combines trend-following elements with oscillator dynamics to reveal shifts in price momentum, trend direction, and potential reversal points across financial assets. By subtracting a longer-term exponential moving average (26-period) from a shorter-term one (12-period), the MACD transforms lagging moving averages into a responsive tool that reflects real-time changes in market sentiment. The result is an intuitive visual system that helps traders spot emerging trends, validate price action, and time entries or exits with greater precision. Its widespread adoption across stocks, forex, and commodities stems from its adaptability—offering actionable insights whether you’re day trading volatile equities or analyzing long-term swings in commodity futures.
Why MACD Matters for Traders

For active traders, MACD serves as a critical filter through which price movement can be assessed beyond surface-level fluctuations. Instead of reacting to individual candlesticks or short-term noise, MACD provides a synthesized view of underlying momentum, helping distinguish between genuine trend strength and temporary price spikes. One of its most valuable functions is identifying divergences—subtle yet powerful warnings that a trend may be losing steam even as price pushes higher or lower. These early signals can mean the difference between riding a reversal early or getting caught in a fading move. Additionally, the indicator’s ability to generate clear, rule-based trading cues—such as line crossovers and histogram shifts—makes it especially useful for developing systematic strategies. When combined with volume, support/resistance levels, or other confirming tools, MACD becomes more than just an indicator; it evolves into a decision-making framework for disciplined trading.
Dissecting MACD: Its Three Essential Components
To truly harness the power of MACD, traders must understand how its three core elements interact. Each component plays a distinct role, and together they form a cohesive system for evaluating momentum dynamics. The synergy between these parts allows for layered analysis—offering both broad trend context and fine-grained entry timing.
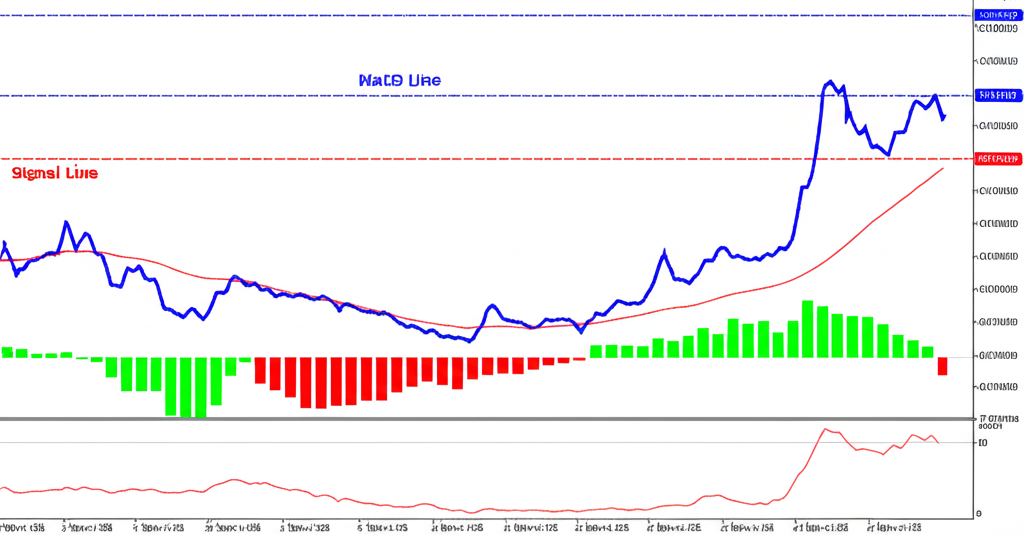
The MACD Line (Fast Line)
At the heart of the indicator lies the MACD Line, often referred to as the “fast line” due to its responsiveness. This line is derived by subtracting the 26-period EMA from the 12-period EMA of closing prices. As new data arrives, the line fluctuates above and below the zero centerline, reflecting the ebb and flow of short-term momentum relative to the longer-term trend. When the MACD Line sits above zero, it suggests that the shorter-term average is outpacing the longer one—a bullish sign. Conversely, when it dips below zero, the opposite holds true, indicating bearish dominance. Because this line reacts quickly to price changes, it forms the foundation for all subsequent signals, including crossovers and divergences.
The Signal Line (Slow Line)
The Signal Line acts as a smoothing mechanism for the MACD Line, calculated as a 9-period EMA of the MACD Line itself. Also known as the “slow line,” it introduces a slight delay, which helps filter out some of the volatility inherent in raw momentum data. Its primary function is to generate trade triggers through crossovers. When the MACD Line crosses above the Signal Line, it suggests accelerating upward momentum; when it crosses below, downward momentum may be building. These intersections are among the most widely watched signals in technical trading, often serving as entry or exit points depending on the broader market context.
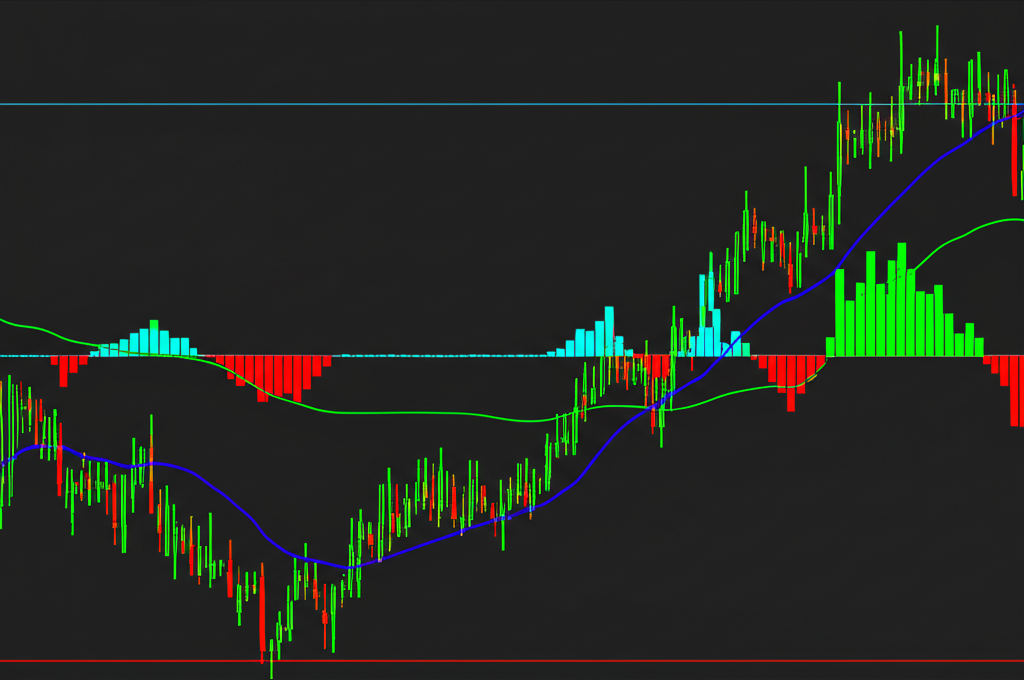
The MACD Histogram
Visualized as a series of vertical bars, the MACD Histogram plots the numerical gap between the MACD Line and the Signal Line. Each bar extends either above or below the zero axis, with positive values indicating the MACD Line is above the Signal Line, and negative values showing the reverse. The height of each bar reflects the strength of the momentum divergence: taller bars signal growing conviction behind the current trend, while shrinking bars suggest weakening momentum. A histogram that transitions from expansion to contraction—even before a crossover occurs—can serve as an early warning of an impending shift, offering traders a proactive edge rather than a reactive one.
How MACD is Calculated: The Exponential Moving Average Foundation
The effectiveness of MACD hinges on its calculation method, particularly its reliance on Exponential Moving Averages (EMAs). Unlike Simple Moving Averages (SMAs), which assign equal weight to all data points in a given period, EMAs place greater emphasis on recent price action. This weighting makes EMAs—and by extension, the MACD—more sensitive to new information, allowing for faster reaction times to shifts in market direction. In fast-moving markets, this responsiveness can provide a critical advantage.
The standard MACD configuration uses three key inputs:
– **MACD Line:** 12-period EMA minus 26-period EMA
– **Signal Line:** 9-period EMA of the MACD Line
– **Histogram:** The difference between the MACD Line and Signal Line
These default values—12, 26, and 9—are not arbitrary. The 12- and 26-period EMAs approximate two weeks and one month of trading activity (assuming five-day trading weeks), making them relevant timeframes for short- to medium-term analysis. The 9-period signal line adds a smoothing layer that helps confirm momentum shifts without introducing excessive lag.
Understanding Exponential Moving Averages (EMAs)
Exponential Moving Averages are essential to the MACD’s design because they reflect the principle that recent price movements carry more predictive value than older ones. This makes EMAs inherently more adaptive than their SMA counterparts, particularly in trending environments where momentum builds over time. For example, during a strong rally, the EMA will rise more steeply than an SMA, capturing acceleration sooner. Similarly, in a sharp sell-off, the EMA reacts faster, giving traders earlier notice of downside pressure. While this sensitivity increases the risk of false signals in choppy or sideways markets, it also enhances the MACD’s ability to catch meaningful moves at an earlier stage—provided it’s used within the right market context.
Interpreting MACD Signals: Your Guide to Market Momentum
Beyond its visual appeal, the real power of MACD lies in its ability to generate actionable trading signals. While no indicator is foolproof, mastering the interpretation of these signals can significantly improve trade timing and risk management. Each signal type offers unique insights, and combining them creates a more comprehensive picture of market dynamics.
MACD Line and Signal Line Crossovers
Crossovers between the MACD Line and the Signal Line are among the most frequently used trading triggers.
– A **bullish crossover** occurs when the MACD Line rises above the Signal Line. This indicates that short-term momentum is beginning to outpace the smoothed average, often signaling the start—or resumption—of an uptrend. Traders may interpret this as a cue to enter long positions, especially if the crossover happens above the zero line or near a key support level.
– A **bearish crossover** happens when the MACD Line falls below the Signal Line, suggesting that upward momentum is waning. This can signal the onset of a correction or downtrend and may prompt traders to exit longs or initiate short positions.
While these crossovers are powerful, they should not be taken in isolation. Context matters—crossovers that occur during strong trends tend to be more reliable than those in range-bound conditions.
Zero Line Crossovers
The zero line serves as a fundamental threshold for assessing overall trend bias.
– A **bullish zero line crossover** occurs when the MACD Line moves from below to above zero. This marks the point where the 12-period EMA surpasses the 26-period EMA, often confirming a shift from bearish to bullish momentum. Such crossovers are particularly significant when they follow extended downtrends and are accompanied by rising volume.
– A **bearish zero line crossover** takes place when the MACD Line crosses below zero, indicating that short-term momentum has turned negative. This can confirm the start of a downtrend, especially if price breaks below key support levels.
These signals offer a broader perspective than simple line crossovers, helping traders align their trades with the dominant trend.
Divergences: Spotting Potential Trend Reversals
Divergences are among the most insightful—and sometimes underappreciated—features of MACD analysis. They occur when price and momentum move in opposite directions, hinting at hidden weakness or strength beneath the surface.
– **Regular Bullish Divergence:** Price records a lower low, but the MACD Line forms a higher low. This suggests bearish momentum is fading despite continued selling pressure, potentially setting the stage for a reversal upward.
– **Regular Bearish Divergence:** Price reaches a higher high, but MACD forms a lower high. This disconnect indicates that buyers are losing conviction, raising the possibility of a downward turn.
– **Hidden Bullish Divergence:** Found within an uptrend, this occurs when price makes a higher low while MACD makes a lower low. It suggests a healthy pullback rather than a reversal, often preceding trend continuation.
– **Hidden Bearish Divergence:** In a downtrend, price makes a lower high while MACD makes a higher high. This reflects temporary buying interest but often precedes renewed selling pressure.
Traders who learn to identify these patterns early can position themselves ahead of major turning points.
Analyzing the MACD Histogram for Momentum Strength
The histogram provides a real-time pulse check on momentum. Its visual simplicity makes it easy to interpret at a glance.
– **Expanding bars**—whether positive or negative—indicate that momentum is intensifying. For example, rapidly growing positive bars suggest strong buying pressure and a likely continuation of the uptrend.
– **Contracting bars**, especially as they approach the zero line, signal diminishing momentum. This contraction often precedes a crossover or reversal and can serve as an early cautionary signal.
A common strategy involves watching for “zero-line hooks,” where the histogram briefly dips below zero during an uptrend but quickly recovers. This can reflect a shallow pullback with strong underlying momentum, offering a low-risk entry opportunity.
Advanced MACD Application: Strategies for Entry and Exit Points
Experienced traders go beyond basic crossovers, using MACD in nuanced ways to refine entries and exits. One such approach involves waiting for crossovers to occur within the context of a larger trend, particularly after a pullback. For example, in a well-established uptrend, a temporary dip below the Signal Line may represent a healthy consolidation. When the MACD Line re-crosses above the Signal Line—especially near a Fibonacci retracement level or established support—it can confirm renewed bullish momentum. This type of confirmation increases the probability of a successful trade.
Exit decisions can also be enhanced with MACD. A sharp contraction in the histogram, even before a bearish crossover, may suggest that momentum is stalling. If this occurs near a resistance zone or with declining volume, it could be a prudent time to take profits or tighten stop-loss orders.
Consider a scenario where a stock pulls back to a key moving average while the MACD remains above zero and begins to turn upward. The histogram starts expanding again, and the MACD Line crosses above the Signal Line. This confluence of factors—price support, positive momentum, and a confirmed crossover—creates a high-conviction setup for a long entry.
Confirming Signals with Other Technical Indicators
MACD performs best when used as part of a multi-layered analysis. Relying on it alone increases the risk of false signals, especially in volatile or sideways markets. Combining it with complementary tools enhances accuracy and builds confidence in trade decisions.
Popular confirmation methods include:
– **RSI (Relative Strength Index):** Helps identify overbought or oversold conditions. A bearish MACD divergence gains more weight if RSI is above 70, while a bullish divergence is stronger if RSI is below 30.
– **Volume Analysis:** Increasing volume during a bullish crossover supports the validity of the signal, suggesting institutional participation.
– **Bollinger Bands:** Can help assess volatility and confirm breakouts. For instance, a MACD crossover occurring as price touches the lower band may indicate oversold conditions and a potential reversal.
– **Support and Resistance Levels:** A MACD signal that aligns with a key price level—such as a previous high or trendline break—is far more reliable than one occurring in neutral territory.
– **Price Action Patterns:** Candlestick formations like bullish engulfing or hammer patterns can add further validation when they coincide with a MACD signal.
By integrating these tools, traders create a robust system that filters out noise and focuses on high-probability opportunities.
Common MACD Settings and Customization Considerations
The standard (12, 26, 9) configuration works well for most traders and timeframes, offering a balanced blend of responsiveness and stability. However, customization can be beneficial depending on trading style and market conditions.
Day traders or those focused on fast-moving assets might opt for shorter settings like (5, 13, 8) to capture rapid momentum shifts. These settings increase sensitivity but also raise the risk of whipsaws. On the other hand, swing traders or investors may prefer longer settings such as (21, 55, 14), which smooth out noise and generate fewer, higher-quality signals over extended periods.
Whatever adjustments are made, rigorous backtesting is essential. A setting that looks perfect on historical data may fail in live markets if it’s over-optimized. Traders should test new configurations across multiple market cycles and asset classes before deploying them in real-time trading.
Limitations of MACD and How to Mitigate Them
Despite its popularity, MACD is not without flaws. As a lagging indicator based on moving averages, it inherently reacts to past price movements rather than predicting future ones. This means signals often appear after a significant portion of a move has already occurred, potentially resulting in late entries or exits.
Another major drawback is its performance in choppy or range-bound markets. In such environments, the MACD Line and Signal Line frequently cross back and forth, generating numerous false signals—commonly known as whipsaws. These can lead to repeated losing trades if not properly managed.
To minimize these risks:
– **Use higher timeframes:** Daily or weekly charts reduce noise and improve signal reliability.
– **Incorporate price context:** Always assess whether price is trending or consolidating. MACD is most effective in trending markets.
– **Combine with leading indicators:** Tools like volume, RSI, or order flow analysis can provide forward-looking clues that MACD lacks.
– **Filter by market regime:** Recognize when volatility is low or when price is trapped in a range. In such cases, alternative strategies may be more appropriate.
As noted by educational resources from brokers like IG, combining MACD with other analytical methods is essential to overcoming its inherent delays and reducing false signals.
MACD vs. RSI: A Comparative Analysis for Momentum Trading
MACD and RSI are both momentum indicators, but they approach the market from different angles. Understanding their differences allows traders to use them synergistically rather than competitively.
| Feature | MACD (Moving Average Convergence Divergence) | RSI (Relative Strength Index) |
| :————– | :—————————————————————————— | :————————————————————————- |
| **Primary Focus** | Trend strength, direction, momentum, and duration; relationship between two EMAs. | Speed and change of price movements; overbought/oversold conditions. |
| **Calculation** | Difference between EMAs; EMA of that difference (Signal Line). | Uses average gains and losses over a period (typically 14). |
| **Range** | Unbounded (oscillates around a zero line). | Bounded (oscillates between 0 and 100, with 30 and 70 as key levels). |
| **Signals** | Crossovers (MACD/Signal, MACD/Zero Line), Divergences, Histogram expansion/contraction. | Overbought (>70), Oversold (<30), Centerline (50) crossovers, Divergences. |
| **Best Use** | Identifying trend changes, confirming trend strength, momentum shifts. | Identifying potential reversals due to extreme price conditions. |
| **Nature** | Lagging indicator (due to moving averages). | Leading or coincident indicator. |
For example, a bullish MACD crossover suggests rising momentum, but if RSI is below 30 and starting to climb, it confirms the move is coming from oversold territory—increasing the signal’s reliability. Conversely, a bearish divergence on MACD gains strength if RSI is simultaneously entering overbought territory. Platforms like BabyPips emphasize that using both indicators together provides a more complete view of market momentum, combining trend confirmation with overextension signals.
Conclusion: Mastering MACD for Informed Trading Decisions
The MACD indicator remains one of the most trusted tools in a trader’s arsenal, offering deep insights into momentum, trend direction, and potential reversals. By understanding its three core components—the MACD Line, Signal Line, and Histogram—and how they are derived from exponential moving averages, traders gain access to a powerful framework for analyzing price behavior. Whether interpreting crossovers, spotting divergences, or monitoring histogram dynamics, MACD provides a structured approach to navigating financial markets.
However, it’s crucial to recognize its limitations. As a lagging indicator, MACD works best when combined with other forms of analysis—such as volume, price action, or leading oscillators like RSI. Used in isolation, it can lead to misleading signals, especially in volatile or non-trending environments. When integrated into a comprehensive strategy, though, MACD becomes a vital component for identifying high-probability setups, managing risk, and improving trade timing. True mastery comes not from treating MACD as a standalone solution, but from leveraging it as part of a disciplined, multi-faceted approach to market analysis.
Frequently Asked Questions about MACD
What does MACD stand for and what is its primary purpose in technical analysis?
MACD stands for Moving Average Convergence Divergence. Its primary purpose in technical analysis is to identify changes in the strength, direction, momentum, and duration of a trend in a financial instrument’s price. It helps traders spot potential buy and sell signals and anticipate trend reversals.
How do you interpret the MACD line and signal line crossovers for trading signals?
A bullish crossover occurs when the MACD Line crosses above the Signal Line, suggesting increasing bullish momentum and a potential buy signal. A bearish crossover occurs when the MACD Line crosses below the Signal Line, indicating increasing bearish momentum and a potential sell signal.
What are MACD divergences, and how can they help predict trend reversals?
MACD divergences occur when the price of an asset moves in the opposite direction of the MACD indicator. For example, if price makes a lower low but MACD makes a higher low (bullish divergence), it can signal weakening bearish momentum and a potential trend reversal upwards. Conversely, a bearish divergence (price makes higher high, MACD makes lower high) can predict a downward reversal. They are considered strong early warning signs.
Is MACD a leading or lagging indicator, and what are its main limitations?
MACD is primarily a lagging indicator because it is based on moving averages of past prices. Its main limitations include:
- Generating signals after a significant portion of a price move has already occurred.
- Producing numerous false signals (whipsaws) in choppy or sideways markets.
What are the standard MACD settings (12, 26, 9), and can they be customized?
The standard MACD settings are:
- 12: For the fast Exponential Moving Average (EMA).
- 26: For the slow EMA.
- 9: For the Signal Line’s EMA.
Yes, these settings can be customized to suit different trading styles, timeframes, or asset classes, though careful backtesting is recommended to avoid over-optimization.
How does the MACD Histogram reflect momentum strength and potential shifts?
The MACD Histogram visually represents the difference between the MACD Line and the Signal Line.
- Expanding bars (taller) indicate strengthening momentum in the current direction.
- Contracting bars (shorter, moving towards zero) signal weakening momentum and often precede a MACD Line/Signal Line crossover or a potential trend reversal.
How does MACD compare to RSI, and when should I use one over the other (or both)?
Both are momentum indicators but measure different aspects:
- MACD focuses on trend strength, direction, and momentum based on moving average convergence/divergence. It’s great for confirming trends and identifying shifts.
- RSI (Relative Strength Index) measures the speed and change of price movements, primarily identifying overbought (>70) or oversold (<30) conditions. It's good for spotting potential reversals due to extreme price levels.
It’s often best to use both MACD and RSI together. MACD might confirm a trend, while RSI could confirm if the move is becoming overextended, providing a more robust trading signal.
Can MACD be effectively used to determine precise entry and exit points for trades?
MACD can be effective for identifying potential entry and exit zones, especially when combined with other indicators and price action. For instance, a bullish crossover after a pullback, confirmed by support levels, can signal an entry. Similarly, a bearish crossover or contracting histogram bars can indicate a good time to exit. However, relying solely on MACD for precise timing can be challenging due to its lagging nature; it’s better used as part of a comprehensive strategy.
What does it mean when the MACD line crosses above or below the zero line?
When the MACD Line crosses above the zero line, it suggests that the 12-period EMA has moved above the 26-period EMA, indicating a shift from bearish to bullish momentum and potentially confirming an uptrend. Conversely, when it crosses below the zero line, it signifies a shift from bullish to bearish momentum, potentially confirming a downtrend.
What are some common mistakes traders make when using MACD, and how can they be avoided?
Common mistakes include:
- Using MACD in isolation: Ignoring other indicators or price action. Avoid by always seeking confirmation from multiple sources.
- Over-reliance in choppy markets: MACD generates many false signals in sideways markets. Avoid by identifying market conditions and using MACD primarily in trending markets or in conjunction with range-bound strategies.
- Ignoring the zero line: Only focusing on crossovers without considering whether they occur above or below the zero line can lead to misinterpretations of overall trend strength.
- Over-optimizing settings: Customizing settings without thorough backtesting can lead to poor real-world performance.
留言