Mastering the Trend: A Comprehensive Guide to Simple Moving Average (SMA) Trading Strategies
Welcome, future trading strategists! Are you ready to delve into one of the most fundamental yet powerful tools in technical analysis? As we navigate the complex world of financial markets, understanding price movements is key. But raw price data can be noisy, like trying to hear a whisper in a crowded room. This is where smoothing techniques come in, and the Moving Average (MA) stands out as a cornerstone.
Think of a Moving Average as a way to filter out the daily market noise – the small, often insignificant fluctuations – to reveal the underlying trend. It takes a set of past price data points and calculates their average, then continuously updates this average as new price data becomes available. As this average moves, it creates a single line on your chart, less jagged than the price itself, giving you a clearer picture of direction.
Why is this so important? Because identifying the trend is often the first step in any strategic approach. Are prices generally going up, down, or sideways? The Moving Average helps us answer this fundamental question with visual clarity. It simplifies the chart, making it easier to spot opportunities aligned with the prevailing market direction.
In this guide, we will explore the world of Moving Averages, starting with the most basic and widely used type: the Simple Moving Average (SMA). We’ll uncover how it’s calculated, why it’s effective, and how you can use it to build robust trading strategies. We’ll also look at its variations, its strengths, and its limitations, providing you with a solid foundation for incorporating this essential tool into your analytical toolkit.
| Concept | Explanation |
|---|---|
| Moving Average | A technique to smooth price data for trend analysis. |
| SMA Calculation | Adds past prices and divides by the number of periods for average. |
| Trend Confirmation | SMA helps identify the trend to guide trading strategies. |
The Simplest Tool: Deconstructing the Simple Moving Average (SMA)
Let’s start at the very beginning with the building block of many trend-following systems: the Simple Moving Average (SMA). As its name suggests, its calculation is beautifully straightforward. You simply take the closing prices of an asset over a specific number of periods (say, 10 days), add them up, and divide by the number of periods (10). This gives you the average price for that specific point in time.
As each new trading period (day, hour, minute, etc.) ends, the oldest price in your set is dropped, and the newest price is added. You then recalculate the average. This continuous process creates the smooth, flowing line we see on charts.
For example, to calculate a 5-day SMA:
- Day 1 SMA: (Price Day 1 + Price Day 2 + Price Day 3 + Price Day 4 + Price Day 5) / 5
- Day 2 SMA: (Price Day 2 + Price Day 3 + Price Day 4 + Price Day 5 + Price Day 6) / 5
And so on. Each day, the window of five days slides forward.
| SMA Length | Characteristics |
|---|---|
| Short Period (e.g., 10, 20) | Reacts quickly to price changes, shows short-term trends. |
| Long Period (e.g., 50, 200) | Smoother line, identifies long-term trends, more lag. |
The length of the period you choose for your SMA is critical. A shorter period (like a 10-day or 20-day SMA) will react very quickly to recent price changes, staying close to the current price. It will show you short-term trends but can also be whipsawed by temporary volatility. A longer period (like a 50-day or 200-day SMA), on the other hand, will be much smoother, reacting more slowly to price changes. It filters out more noise and helps identify longer-term trends, but it will have more “lag.”
This concept of lag is fundamental to understanding SMAs and other Moving Averages. Because the SMA includes older data points that are equally weighted with newer ones, it inherently trails the current price action. A longer SMA trails price more than a shorter one. This lag means the SMA confirms a trend *after* it has already begun, and it will give you a signal to exit a trend *after* the price has already started to reverse. Is this a weakness? It can be, but it’s also part of what makes it effective at filtering out false signals caused by minor price bumps.
Beyond Simple: Exploring Other Moving Average Types (EMA, LWMA, etc.)
While the Simple Moving Average is the foundation, it’s not the only Moving Average available to technical analysts. The main criticism of the SMA is its equal weighting of all data points within the chosen period. Doesn’t the most recent price data matter more? Many traders and analysts believe it does, which led to the development of other Moving Average types that give more weight to recent prices.
The most popular alternative is the Exponentially-Weighted Moving Average (EWMA), commonly known as the Exponential Moving Average (EMA). The EMA calculation is more complex than the SMA, using a smoothing factor that gives exponentially decreasing weight to older prices. This means the EMA reacts faster to recent price changes than the SMA of the same period length. It has less lag, making it potentially more useful for traders looking for earlier entry or exit signals.
Other variations exist, each with its own specific weighting method:
- Linearly-Weighted Moving Average (LWMA): Assigns a numerical weight to each price point, decreasing linearly from the most recent to the oldest. The most recent price gets the highest weight.
- Triangular Moving Average (TMA): Essentially an SMA of an SMA. It gives the most weight to the prices in the middle of the data series. This results in an even smoother line than an SMA of the same length, having more lag.
- Kaufman Adaptive Moving Average (KAMA): Developed by Perry Kaufman, this is a more sophisticated MA that adjusts its sensitivity based on market volatility and noise. It tries to follow prices closely when the market is trending strongly but smooth out signals when the market is choppy or sideways.
- Wilder Moving Average: Developed by Welles Wilder (creator of the RSI), this MA is used in indicators like the Average True Range (ATR). It’s a type of smoothed average that assigns more weight to recent data, similar in effect to an EMA.
Each of these Moving Average types offers a different balance between smoothing (filtering noise) and lag (reacting quickly). The choice of which MA type to use often depends on your trading style, the asset you’re analyzing, and the timeframe you’re working with. Do you prefer a smoother line for clearer long-term trends (perhaps an SMA or TMA), or a faster line for quicker signals (perhaps an EMA or LWMA)? There’s no single “best” MA; it’s about finding the one that aligns with your analytical goals.
Identifying the Market’s Direction: Using MAs for Trend Analysis
One of the most fundamental uses of a Moving Average, especially the SMA, is for straightforward trend identification. Because the MA smooths out price fluctuations, its direction visually represents the prevailing market trend over the chosen period.
How do we read this? It’s quite simple:
- If the Moving Average line is sloping upwards, it indicates that the average price over the period is increasing. This suggests the asset is in an uptrend.
- If the Moving Average line is sloping downwards, it indicates that the average price is decreasing. This suggests the asset is in a downtrend.
- If the Moving Average line is relatively flat, or if price crosses back and forth across it frequently, it suggests the asset is moving sideways or consolidating, and there is no clear strong trend in either direction over that period.
Beyond just the slope, the relationship between the current price and the Moving Average line itself is a powerful trend signal. In a strong uptrend, price will typically remain *above* the Moving Average. The MA can then act as a dynamic area of potential support during pullbacks. Conversely, in a strong downtrend, price will typically remain *below* the Moving Average, and the MA can act as a dynamic area of potential resistance during bounces.
Consider using a longer SMA, like the 50-day or 200-day SMA, to identify the dominant long-term trend. If the 200-day SMA for a stock is pointing up and the price is trading above it, that confirms a bullish long-term outlook. This simple visual check provides immediate context and helps you trade with the larger flow of the market, rather than against it.
However, remember the lag. The MA’s direction will lag behind the price. Price will often start trending up before the MA turns upwards, and price will start falling before the MA turns downwards. This isn’t a flaw; it’s just the nature of using an average. It’s a confirmation tool, validating the trend that price action might already be hinting at.
Dynamic Levels: How Moving Averages Act as Support and Resistance
As we touched upon, Moving Averages can serve a dual purpose beyond just identifying the trend direction. They also frequently function as dynamic levels of Support and Resistance.
In an uptrend, traders often observe that when the price of an asset pulls back, it finds buying interest near the Moving Average line. The MA, therefore, acts as a dynamic support level. Why might this be? Traders who use MA-based strategies might see the price touching or dipping slightly below the MA as a potential buying opportunity within the established uptrend. They are essentially betting that the underlying average price trend will continue and push the price back up.
Conversely, in a downtrend, when the price attempts to rally or bounce, it often encounters selling pressure near the Moving Average line. In this scenario, the MA acts as a dynamic resistance level. Traders looking to enter short positions or exit long positions might see a bounce up to the MA as an ideal level to initiate their trade, anticipating that the prevailing downtrend will resume and push the price lower again.
| MA Type | Use as Support/Resistance |
|---|---|
| 20-period SMA/EMA | Common for short-term trends, often acts as key support. |
| 50-period SMA/EMA | Used for medium-term trend analysis; provides dynamic levels. |
| 200-period SMA/EMA | Typical for long-term strategies; confirms major trend direction. |
Commonly used Moving Averages for identifying these dynamic Support and Resistance levels include the 20-period, 50-period, 100-period, and 200-period MAs (both SMA and EMA). The specific periods that work best can vary depending on the asset and the timeframe you are trading. For instance, day traders might look at 20-period or 50-period MAs on a 15-minute chart, while swing traders might focus on 50-period or 200-period MAs on a daily chart.
It’s important to note that these levels are not fixed lines like traditional horizontal Support and Resistance. They move and change with the average price, making them dynamic. Price may overshoot or undershoot the MA slightly before reversing. Therefore, it’s often best to view the MA as a potential *zone* of Support or Resistance, rather than a precise line.
Using MAs as dynamic Support and Resistance levels can be a powerful strategy, especially when combined with other forms of analysis, like candlestick patterns or other indicators, which might signal a potential bounce or reversal occurring *at* the MA level.
The Classic Signal: Implementing the Moving Average Crossover Strategy
One of the most popular and widely taught Moving Average strategies is the Moving Average Crossover. This strategy involves plotting two Moving Averages on the same chart – one with a shorter period (a “fast” MA) and one with a longer period (a “slow” MA).
The logic is based on the idea that the faster MA (which reacts more quickly to price changes) will cross above or below the slower MA (which reacts more slowly) to signal a shift in the trend or momentum. Essentially, the fast MA leads the slow MA, and the crossover indicates that the shorter-term average price is changing direction relative to the longer-term average price.
Here’s how the signals are typically interpreted:
- Bullish Crossover (Buy Signal): When the fast Moving Average crosses *above* the slow Moving Average. This suggests that recent prices are trending upwards faster than longer-term prices, indicating increasing bullish momentum and potentially the start of an uptrend. This event is famously known as the “Golden Cross” when a 50-period MA crosses above a 200-period MA, often considered a significant long-term bullish signal.
- Bearish Crossover (Sell/Short Signal): When the fast Moving Average crosses *below* the slow Moving Average. This suggests that recent prices are trending downwards faster than longer-term prices, indicating increasing bearish momentum and potentially the start of a downtrend. The opposite of the Golden Cross, the “Death Cross,” occurs when a 50-period MA crosses below a 200-period MA, often seen as a significant long-term bearish signal.
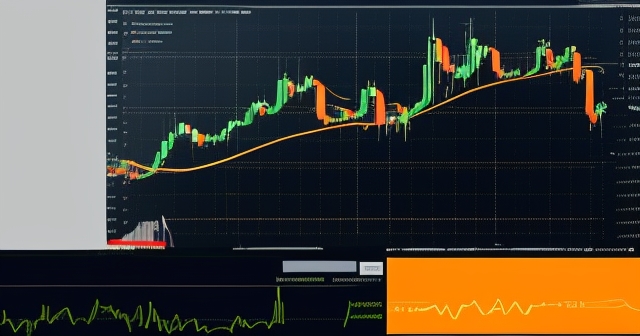
Common combinations for crossover strategies include the 10-period and 20-period MAs (short-term trading), 20-period and 50-period MAs (medium-term), and 50-period and 200-period MAs (long-term investing). You can use SMA or EMA for this. EMAs will produce signals faster due to less lag, while SMAs will produce signals with more delay but potentially filter out more false signals.
While seemingly simple, implementing a crossover strategy effectively requires careful consideration of the chosen periods and the MA type. Shorter period crossovers will generate more signals, including more false ones in choppy markets. Longer period crossovers generate fewer signals, which are often more reliable for major trend changes but occur with significant lag, potentially causing you to miss a large portion of the move.
Like all technical tools, the crossover strategy is not foolproof. It can generate false signals in sideways markets where the MAs are intertwined. It works best when a clear trend is developing. Therefore, many traders combine crossover signals with other indicators or chart patterns for confirmation.
Adding Depth: Multi-Timeframe Analysis with Moving Averages
To enhance the effectiveness of any Moving Average strategy, including the SMA crossover, incorporating Multi-Timeframe Analysis is a widely recommended practice. Instead of looking at MAs on just one chart timeframe (e.g., only a daily chart), you examine the same asset and MA periods across different timeframes simultaneously.
Why is this powerful? Because trends exist at different scales. An asset might be in a short-term downtrend on an hourly chart but still within a larger, long-term uptrend on a daily or weekly chart. Trading against the larger trend is generally riskier. Multi-timeframe analysis helps you identify the dominant trend context before acting on signals from a shorter timeframe.
| Analysis Step | Description |
|---|---|
| Identify Long-Term Trend | Use longer timeframe MAs (e.g., 50 or 200) to determine overall direction. |
| Identify Medium-Term Trend | Analyze medium timeframe with MAs for price behavior in the larger trend. |
| Generate Entry/Exit Signals | Look for trading signals on shorter timeframes that align with identified trends. |
For example, if the daily 200-day SMA shows a strong uptrend, you might look for pullbacks towards the 50-day SMA on the daily chart or look for bullish crossovers on the hourly chart *only when price is above the daily 50-day SMA*. This approach helps filter out false signals that might occur on the shorter timeframe if they contradict the direction of the longer-term trend.
Multi-timeframe analysis with MAs provides a hierarchical view of the market. It allows you to trade with higher conviction when signals from different timeframes align, and helps you avoid low-probability trades that go against the dominant market direction. It adds a crucial layer of context to your SMA trading strategy.
Real-World Application: MA Strategies Across Different Markets
One of the greatest strengths of Moving Average strategies, including those based on the SMA, is their versatility. They are not confined to a single market or asset class. You can apply these principles to virtually any financial instrument that has historical price data and is traded on a chart.
Let’s consider some examples:
- Stocks and Indices: This is perhaps the most common application. Traders use MAs on individual stocks (like AAPL, IBM, LMT) or major indices (like SPY, QQQ, IWM) to identify trends, potential Support and Resistance levels, and crossover signals. For instance, observing that the SPY ETF is trading above its 200-day SMA is a common bullish indicator for the broader US market.
- Commodities: MAs are equally effective on commodities like Gold, Oil, or agricultural products. Traders use them to follow the sometimes volatile trends in these markets. A gold trader might watch the 50-day SMA for signs of a shift in medium-term momentum.
- Forex (Foreign Exchange): The Forex market, known for its volatility and liquidity, is another area where MA strategies are widely used. Currency pairs like EUR/USD or GBP/JPY can be analyzed using crossovers or MA Support/Resistance bounces across various timeframes, from minutes to weeks. If you’re considering starting Forex trading or exploring a wider range of CFD products, then Moneta Markets is a platform worth considering. Hailing from Australia, it offers over 1000 financial instruments, catering to both novice and professional traders.
- Binary Options: While highly speculative and carrying significant risk (more on this shortly), some traders attempt to use technical indicators like MAs on platforms offering binary options. They might look for quick crossovers or bounces off MAs on very short timeframes (like 1-minute or 5-minute charts) to predict short-term price direction. However, the lag inherent in MAs can make them less effective for the rapid expiry times common in binary options.
The principles remain the same: smooth price data, identify trend direction, spot potential Support/Resistance, and generate signals from crossovers. The specific periods used might be adjusted based on the typical volatility and cycle length of the asset, but the underlying theory holds.
Whether you’re looking at a blue-chip stock, a volatile commodity, or a major currency pair, the SMA and its counterparts provide a consistent framework for analyzing price behavior and formulating your trading approach. Just remember that different markets have different characteristics, and backtesting your chosen MA strategy on the specific asset and timeframe you intend to trade is always recommended.
Effectiveness and Limitations of MA Strategies
Moving Average strategies, particularly those using the SMA, are popular for good reasons: they are relatively simple to understand and implement, and they provide a clear visual representation of the trend. For beginners, they offer a structured way to approach technical analysis without getting lost in overly complex calculations.
However, it’s crucial to have a balanced view. MA strategies are not without their limitations, and understanding these drawbacks is key to using them responsibly and effectively.
| Pros | Cons |
|---|---|
| Simplicity: Easy to grasp. | Lag: Trails current price, generating delayed signals. |
| Trend Identification: Confirms direction quickly. | Whipsaws: Poor performance in sideways markets. |
| Dynamic Support/Resistance: Useful moving levels. | Parameter Dependency: Effectiveness varies by period. |
| Versatility: Applicable across various assets. | Not Predictive: Confirms trends, doesn’t predict them. |
| Foundation: Many indicators are built on MAs. | Standalone Limitations: Requires additional analysis tools. |
Experienced traders understand that no single indicator is a crystal ball. While MAs are invaluable for trend filtering and providing structural context, they are best used in conjunction with other forms of technical analysis (like price action, chart patterns, and other indicators) and fundamental analysis, as well as robust risk management practices.
The debate on the profitability of MA strategies as standalone systems is ongoing, but the general consensus among seasoned professionals is that their primary value lies in confirming trends, providing dynamic levels, and serving as components within more comprehensive trading systems.
Combining Tools: Integrating MAs with Other Technical Indicators
As we’ve discussed, while Simple Moving Averages and other MAs are powerful on their own, their effectiveness can be significantly enhanced when used in conjunction with other technical indicators. This approach provides confirmation and helps filter out false signals that might be generated by a single indicator in isolation.
Many technical indicators actually incorporate Moving Averages in their calculation, or are designed to complement them. Let’s look at a few examples:
- Moving Average Convergence Divergence (MACD): Developed by Gerald Appel, the MACD is a trend-following momentum indicator that shows the relationship between two Moving Averages (typically 12-period and 26-period EMAs) and a signal line (a 9-period EMA of the MACD line itself). Crossovers on the MACD line can confirm trend changes indicated by price or MA crossovers. Divergence between price and MACD can signal potential trend weakness or reversals.
- Relative Strength Index (RSI): Developed by Welles Wilder, the RSI is a momentum oscillator that measures the speed and change of price movements. It oscillates between 0 and 100. While not directly using MAs in its standard calculation, traders often use RSI in conjunction with MAs. For example, in an uptrend confirmed by a rising SMA, a trader might look for the RSI to pull back to the 40-50 area before resuming its move higher, signalling a potential low-risk entry point aligned with the trend. Conversely, high RSI values (above 70, indicating overbought) or low values (below 30, indicating oversold) can signal that a trend might be due for a pullback or consolidation, giving caution to MA trend-following signals.
- Bollinger Bands®: Developed by John Bollinger, these bands plot a Simple Moving Average (typically 20-period) in the middle, with upper and lower bands set a certain number of standard deviations away from the MA. Bollinger Bands measure volatility. Price often fluctuates between the bands, and touches or breaks of the bands can signal potential reversals or continuation. Using Bollinger Bands alongside MAs helps you assess volatility and potential price extremes relative to the average.
By combining MAs with oscillators like RSI or MACD, you can get a better sense of the momentum behind the trend identified by the MA. Are buyers/sellers losing steam even if the MA is still trending? Combining MAs with volatility indicators like Bollinger Bands helps you understand if price is extended relative to its average. Combining MAs with volume indicators can also add conviction – a breakout above an MA on high volume is generally seen as more significant than one on low volume.
The key is to use indicators that complement each other and provide different perspectives. Avoid using multiple indicators that essentially measure the same thing (e.g., using several different types of MAs simultaneously might be redundant). Experiment and find the combinations that best suit your trading style and the assets you trade, always testing them rigorously.
Refining Your Approach: Backtesting and Adapting MA Strategies
Having a solid understanding of Simple Moving Averages and other types is the first step. The next crucial step in developing a successful SMA trading strategy (or any MA strategy) is rigorous testing and adaptation. The financial markets are dynamic, and what worked well in one period or for one asset might not work as well in another. Blindly applying a generic strategy without testing can lead to significant losses.
Backtesting is the process of applying your trading strategy to historical price data to see how it would have performed in the past. This involves setting clear rules for entry and exit signals based on your chosen MAs (e.g., “Buy when the 20-period SMA crosses above the 50-period SMA; Sell when the 20-period SMA crosses below the 50-period SMA”) and then simulating trades based on those rules over a significant historical period.
What should you look for during backtesting? You want to evaluate key performance metrics such as:
- Total net profit/loss
- Winning percentage
- Average profit per trade
- Average loss per trade
- Maximum drawdown (the largest peak-to-trough decline in equity)
- Profit factor (gross profit divided by gross loss)
- Number of trades (helps assess how frequently signals occur)
Backtesting helps you understand the potential profitability and risk characteristics of your strategy *before* risking real capital. It can reveal whether your chosen MA periods are too sensitive (generating too many losing trades in choppy markets) or too slow (missing too much of the move). It allows you to compare different MA types (SMA vs. EMA) or different period combinations to see which yielded better historical results for the specific asset you are interested in.
Based on your backtesting results, you can then **adapt** your strategy. Perhaps a 20/50 SMA crossover was too laggy on a particular stock, but a 10/30 EMA crossover provided better signals. Maybe you discover that adding a filter – like only taking bullish signals when price is above the 200-period SMA – significantly improved results by keeping you out of downtrends. Adaptation is an ongoing process.
It’s important to backtest on a sufficiently large dataset to ensure the results are statistically significant and not just a fluke of a particular market period. Also, be aware of the limitations of backtesting; past performance is not indicative of future results. Market conditions change. However, a strategy that has shown consistent positive results over a diverse range of historical conditions is generally more robust than one that hasn’t.
Many charting platforms offer tools for automated backtesting, making this process more efficient. Dedicating time to testing and refining your MA strategies is a vital step in moving from simply understanding the tools to potentially trading them profitably.
Navigating the Risks: Essential Considerations for Trading with MA Strategies
Understanding technical analysis tools like Simple Moving Averages and developing trading strategies is empowering, but it is absolutely critical to couple this knowledge with a deep understanding of the inherent risks involved in trading financial markets. No trading strategy, including those based on MAs, can guarantee profits, and you should always be prepared for the possibility of losses.
Trading, by its very nature, involves financial risk. You are putting capital at risk with the expectation of generating returns. However, market prices can move unexpectedly, and even well-researched trades based on sound technical analysis can result in losses. Leverage, which allows you to control a larger position with a smaller amount of capital, can magnify both profits and losses, increasing the risk significantly.
Certain instruments, like futures, options, and particularly Binary Options, carry extremely high levels of risk. Binary options trading, for example, involves predicting whether an asset’s price will be above or below a certain level at a specific future time. This is often framed as an “all-or-nothing” payout. Due to their structure and high risk, binary options are prohibited for retail traders in many jurisdictions, including by the CFTC in the United States. It is vital to be aware of the regulatory landscape and the risks associated with any instrument you consider trading.
When employing MA strategies, remember their limitations: lag and susceptibility to false signals in choppy markets. A Golden Cross doesn’t guarantee an uptrend will continue indefinitely, and a Death Cross doesn’t assure a market crash. These are signals based on historical price averages, not predictions of the future.
Therefore, incorporating robust risk management is non-negotiable. This includes:
- Setting Stop-Loss Orders: These orders automatically close your position if the price moves against you by a predetermined amount, limiting your potential loss on any single trade.
- Position Sizing: Never allocate an excessive portion of your capital to a single trade. A common guideline is to risk only a small percentage (e.g., 1-2%) of your total trading capital on any given trade.
- Diversification: Don’t put all your capital into one asset or one market.
- Emotional Control: Stick to your trading plan and avoid making impulsive decisions based on fear or greed.
- Continuous Learning: Markets evolve, and so should your understanding and strategies.
Before you start trading with real money, especially if you are new, consider practicing with a demo account offered by brokers. This allows you to test your strategies and get comfortable with the platform and execution without risking capital. Choosing a regulated broker that provides tools and resources for risk management is also essential. If you are seeking a regulated Forex broker capable of global trading, Moneta Markets holds multi-jurisdictional regulatory licenses including FSCA, ASIC, FSA, and offers comprehensive support such as segregated client funds, free VPS, and 24/7 multilingual customer service, making it a preferred choice for many traders.
Trading is challenging, and a significant percentage of retail traders lose money. Approach it with caution, respect the risks, and always prioritize capital preservation.
Conclusion: Leveraging the Power of Moving Averages Wisely
We have journeyed through the world of Moving Averages, starting with the simple yet powerful Simple Moving Average (SMA), exploring its calculation, its role in identifying trends and dynamic Support/Resistance, and its application in classic strategies like the Moving Average Crossover. We also delved into other MA types, the importance of multi-timeframe analysis, the broad applicability of these tools across different markets (stocks, indices, commodities, and yes, even the high-risk binary options space), the critical assessment of their effectiveness and limitations, and how they integrate with other technical indicators.
Moving Averages are indispensable tools in the technical analyst’s arsenal. They provide clarity in chaotic markets, helping us visualize trends and potential turning points. The SMA, with its simplicity, remains a timeless favorite for filtering noise and understanding the basic directional momentum of an asset. Other MAs, like the EMA, offer different sensitivities to suit various trading styles and objectives.
However, as we emphasized, no indicator is perfect. MAs come with inherent lag and can be prone to false signals in sideways markets. Their true power is unlocked not when used in isolation, but when combined with other forms of analysis – price action, chart patterns, other indicators like MACD or RSI, and crucially, multi-timeframe perspective.
Remember that technical analysis, including the use of MAs and SMA trading strategies, is about probability and risk management, not certainty. It provides frameworks for identifying potential trading opportunities, but it does not predict the future with guaranteed accuracy. Backtesting and adapting your strategies to specific market conditions and assets are vital steps in the process.
Most importantly, approach trading with discipline and a thorough understanding of the risks involved. Financial markets can be unforgiving, and risking capital requires careful planning, proper position sizing, and emotional control. Educational resources, demo accounts, and choosing a reputable broker are all part of building a sustainable trading journey.
By mastering the principles of Moving Averages and integrating them thoughtfully into your analytical process, you gain a valuable tool for understanding market dynamics and making more informed trading decisions. Continue to learn, practice, and adapt – the path to becoming a proficient trader is one of continuous development.
sma trading strategyFAQ
Q:What is a Simple Moving Average (SMA)?
A:The Simple Moving Average is calculated by taking the average of an asset’s price over a specific number of periods, filtering out market noise.
Q:How can I use MA crossovers in trading?
A:MA crossovers occur when a short-term MA crosses a long-term MA, signaling potential changes in market trends, such as buying when the short term crosses above the long term.
Q:What are the limitations of trading with Moving Averages?
A:Moving Averages can lag behind current prices and may generate false signals during sideways market conditions, requiring supplementary analysis methods.
留言