

Navigating the Deceptive Waters: A Comprehensive Guide to Bull Traps in Financial Markets
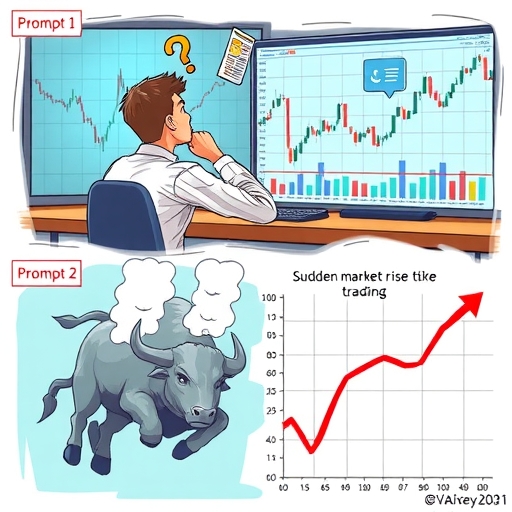
Welcome, fellow navigators of the financial seas. In the dynamic world of trading, few phenomena are as psychologically taxing and financially detrimental as the bull trap. It’s a cunning market maneuver that lures unsuspecting participants into what appears to be a robust recovery, only to pull the rug out from under them, leading to unexpected and often significant losses. As aspiring and experienced traders, understanding these deceptive patterns is not just an advantage; it’s a fundamental pillar of resilient risk management and strategic profitability. Have you ever felt the thrill of a market turning upwards after a long decline, only to see your gains evaporate as quickly as they appeared? That exhilarating ascent, followed by a sudden, jarring descent, is often the signature of a bull trap.
In this comprehensive guide, we will embark on a journey to demystify the bull trap. We’ll delve into its intricate anatomy, uncover the psychological triggers that make us vulnerable, equip you with the technical tools to spot its tell-tale signs, and provide you with actionable strategies to safeguard your capital. Our mission is to empower you with the knowledge to identify these false signals, transform moments of potential loss into opportunities for learning, and ultimately, to help you trade with greater confidence and discipline across various financial instruments, whether you’re dealing with stocks, cryptocurrencies, forex, or commodities.
Here are three key points summarizing the concept of bull traps:
- Misleading Signals: Bull traps occur when a declining asset briefly shows signs of recovery, tricking traders into believing a market change is happening.
- Psychological Manipulation: Traders often fall for bull traps due to psychological factors like FOMO, leading to impulsive buying without thorough analysis.
- Critical Analysis Required: Spotting bull traps necessitates careful examination of trading volume, price action, and broader market conditions.
What is a Bull Trap? Defining the Deception in Market Reversals
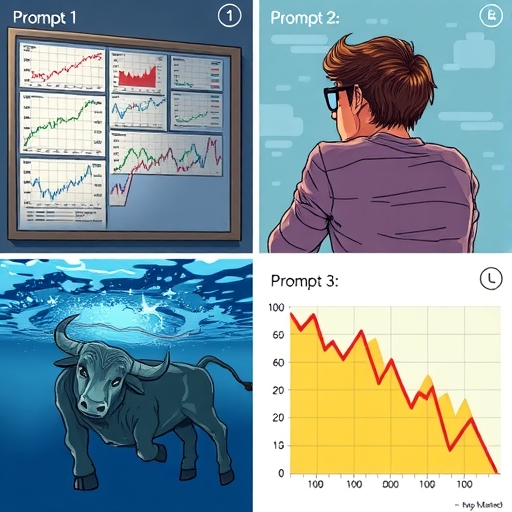
At its core, a bull trap is a misleading market signal where a declining asset, which has been in a sustained downtrend, temporarily reverses course and shows a convincing, albeit short-lived, uptrend. This sudden surge in price appears to signal a genuine market reversal, attracting ‘bulls’ – buyers optimistic about the asset’s future. They rush in, eager to catch the bottom and ride the anticipated wave upwards, only to find themselves ‘trapped’ when the price abruptly pivots downwards again, resuming its original downtrend. This rapid reversal leaves them holding long positions that quickly turn unprofitable, forcing them to exit at a loss.
The bull trap is also known by several evocative names that underscore its deceptive nature: a “whipsaw pattern” due to the swift, violent reversal of price action; a “sucker rally” because it entices unsuspecting buyers; or a “dead cat bounce,” a somewhat morbid but fitting metaphor suggesting that even a dead cat will bounce if dropped from a great enough height, implying a temporary, unsustainable rebound in an otherwise failing asset. While these terms are often used interchangeably, they all point to the same critical phenomenon: a false positive in market recovery, particularly prevalent during periods of market uncertainty or high volatility.
Consider a stock that has been steadily falling for weeks. Suddenly, it experiences a sharp increase in price over a few days, perhaps breaking above a recent resistance level. News might spread, or a collective sense of optimism might take hold. Traders, fearing they are missing out on a significant recovery, jump in, establishing long positions. However, this perceived recovery lacks genuine buying pressure, and within a short period, the original selling pressure reasserts itself, sending the stock tumbling even lower than before, often leaving those newly established long positions underwater. This is the classic scenario of a bull trap, a stark reminder that not all rallies are created equal.
| Term | Description |
|---|---|
| Whipsaw Pattern | A market pattern characterized by rapid and sharp reversals. |
| Sucker Rally | A temporary rally that misleads traders into thinking the market is recovering. |
| Dead Cat Bounce | A small, short-lived recovery in a declining market. |
The Psychological Undercurrents: Why We Fall for Bull Traps
Understanding the technical aspects of a bull trap is crucial, but equally important is recognizing the powerful psychological forces that make us susceptible to them. Financial markets are not merely cold calculations; they are a complex interplay of human emotions, biases, and herd mentality. When an asset has been in a prolonged downtrend, traders and investors become increasingly anxious, searching for any sign of a turnaround. This creates fertile ground for a sucker rally to take hold.
One of the most potent drivers of impulsive buying during a false rally is the Fear of Missing Out (FOMO). After enduring a period of losses or missed opportunities, the sight of a suddenly rising price can trigger an intense desire to jump in, lest we miss the next big thing. This emotional urgency often overrides rational analysis, leading traders to enter positions without sufficient confirmation or adherence to their predefined trading strategy. The market, in essence, preys on our inherent human desire for quick gains and our aversion to being left behind.
Beyond individual psychology, collective market sentiment also plays a significant role. False news, sensationalized headlines, or even social media speculation can create an artificial sense of optimism, leading to a surge in buying activity that lacks any fundamental basis. In the world of cryptocurrencies, for instance, we’ve seen instances where malicious actors orchestrate “pump-and-dump” schemes or even outright “rug pulls,” where project founders intentionally inflate a token’s price through deceptive marketing, only to disappear with investor funds, leaving the asset worthless and creating a massive bull trap for latecomers. These external factors, combined with our internal biases, create a dangerous cocktail that can lead even seasoned traders astray. Cultivating a disciplined, unemotional approach to trading is paramount to resisting these psychological lures.
Here’s a table illustrating the main psychological factors influencing traders in bull traps:
| Psychological Factor | Description |
|---|---|
| FOMO | The fear of missing an opportunity, often leading to impulsive buying. |
| Herd Mentality | The tendency to follow the actions of others in the market. |
| Confirmation Bias | Focusing on information that confirms existing beliefs while ignoring contradictory evidence. |
The Technical Anatomy of a Bull Trap: Volume, Resistance, and Price Action
To effectively spot a bull trap, we must become adept at reading the market’s language through technical analysis. The most telling signs often manifest in three key areas: trading volume, price interaction with resistance levels, and the overall price action itself. A genuine market reversal, or a sustainable uptrend, is typically accompanied by robust and increasing buying volume, indicating strong institutional and retail interest backing the price movement. In contrast, a false breakout, the hallmark of a bull trap, usually occurs on weak or declining trading volume.
Imagine a stock attempting to break above a significant resistance level – a price point where selling pressure has historically overwhelmed buying pressure, causing the price to reverse downwards. In a true breakout, the price would surge past this level with significant volume, signaling that buyers have decisively overcome sellers. However, in a bull trap scenario, the price might briefly poke above the resistance level, perhaps with an initial burst of volume, but this surge is not sustained. The trading volume quickly dissipates, indicating a lack of conviction from the buyers. The price then typically retreats back below the resistance level, often turning that former resistance into a new, stronger resistance point. This failure to convincingly hold above a critical level is a major red flag.
Furthermore, observe the quality of the price action. Are the bullish candlesticks strong, well-formed, and indicative of continued buying pressure? Or are they less convincing, perhaps appearing as large single candles that seem to exhaust buying momentum, followed by indecision or immediate selling? A rapid, almost vertical price increase without any fundamental news or strong, consistent follow-through from subsequent candles often signals an unsustainable spike, indicative of a sucker rally. We are looking for confirmation, consistency, and conviction in the market’s movements, not fleeting enthusiasm. Always question the ‘why’ behind a sudden rally, especially if it appears against a backdrop of a prevailing downtrend.
Decoding Candlestick Patterns: Visual Cues of a False Rally
Candlestick patterns are powerful visual representations of price action, offering invaluable insights into market sentiment and potential future movements. For traders focusing on technical analysis, recognizing certain patterns during a suspected rally can serve as an early warning system for a bull trap. While individual candlesticks provide immediate information, their sequence and relationship to each other paint a larger picture of conviction or deception.
Consider the appearance of an unusually large bullish candlestick during a rally following a downtrend. While this might initially seem encouraging, it can sometimes signal a “last gasp” of buying pressure before exhaustion. If such a candle appears with relatively low trading volume or is immediately followed by bearish candlesticks, it strongly suggests a lack of sustained interest. Conversely, a genuine reversal would typically show a series of smaller, consistent bullish candles with increasing volume, indicating gradual and sustainable accumulation.
More specifically, look out for reversal patterns that form after the asset has seemingly broken out upwards:
- Bearish Engulfing Pattern: A large bearish candle that completely covers the body of the previous bullish candle, indicating a strong shift from buying to selling pressure.
- Evening Star: A three-candlestick pattern where a large bullish candle is followed by a small-bodied candle (often a Doji Star, indicating indecision), and then a large bearish candle. This pattern signals a potential top and reversal.
- Doji Star at Resistance: If a Doji Star (a candle with a very small body, indicating indecision) appears after a rally and precisely at a key resistance level, it suggests that buyers are losing steam and sellers might be preparing to take control.
- Shooting Star: A bearish reversal candlestick with a small body near the bottom of the range and a long upper shadow, appearing after an uptrend, signifying that buyers pushed prices up but sellers immediately pushed them back down.
These patterns, especially when they form at critical resistance levels or are accompanied by declining volume, provide strong visual cues that the rally might be a sucker rally, poised to reverse back into its original downtrend. Learning to read these visual signals will significantly enhance your ability to preemptively identify and avoid a bull trap.
The Relative Strength Index (RSI) and Divergence: An Early Warning System
The Relative Strength Index (RSI) is a momentum oscillator widely used in technical analysis to measure the speed and change of price movements. It oscillates between zero and 100, typically indicating overbought conditions above 70 and oversold conditions below 30. While these thresholds are useful, the RSI becomes a particularly powerful tool for detecting potential bull traps when we observe divergence.
A classic sign of an impending bull trap, often preceding a sharp downturn, is bearish divergence. This occurs when the asset’s price makes a higher high, but the RSI simultaneously makes a lower high. In simpler terms, while the price is still pushing upwards, the underlying momentum, as measured by the RSI, is actually weakening. This divergence signals that the buying pressure is not as strong as the price action suggests, indicating a potential exhaustion of the current rally. It’s like a car accelerating, but the engine’s RPMs are dropping – a clear sign that the upward movement is unsustainable.
For example, if a stock or cryptocurrency has been in a downtrend and then attempts a rally, pushing to a new local high, you would typically expect the RSI to also reach a new corresponding high, reflecting the strength of the move. However, if the price hits a new high, but the RSI fails to surpass its previous high from an earlier rally attempt, this RSI divergence creates a significant warning. It suggests that while bulls managed to push the price up, their collective strength is waning, making the rally susceptible to a sudden reversal. Combining this insight with low trading volume and failure to break key resistance levels paints a very clear picture of an imminent bull trap, providing you with a crucial early warning to either avoid entering a long position or to consider taking profits if you were already in a trade.
Beyond Indicators: Analyzing Market Context and Fundamental Drivers
While technical indicators provide invaluable insights, relying solely on them can be a pitfall. A holistic understanding of the market requires us to zoom out and analyze the broader market context and, where applicable, the fundamental drivers behind an asset’s valuation. A bull trap is often more likely to occur in a larger bear market or during periods of significant economic uncertainty. In such environments, even seemingly positive news or a technical breakout can be fleeting, as the overarching negative sentiment and selling pressure quickly reassert themselves.
Consider the macro environment: Is the economy in a recession? Are interest rates rising? Are there geopolitical tensions? These larger forces can create a pervasive selling bias that even a strong technical setup might not overcome. For instance, a stock might show a technical rally, but if its underlying company fundamentals are deteriorating (e.g., declining revenues, increasing debt, poor earnings reports), that rally is likely to be a sucker rally. Similarly, in the crypto space, while technical analysis is paramount, major regulatory crackdowns, project failures, or shifts in investor sentiment towards the broader crypto market can trigger rapid declines that invalidate any perceived technical recovery, leading to widespread bull traps.
| Market Context Factor | Effect on Bull Traps |
|---|---|
| Economic Recession | Increased likelihood of bull traps due to overall negative sentiment. |
| Rising Interest Rates | Creates pressure on asset prices, heightening risk of traps in rallies. |
| Geopolitical Tensions | Can exacerbate volatility and create false bullish signals. |
Always ask: What is the underlying narrative? Is there genuine news driving this rally, or is it just speculative enthusiasm? A sustainable uptrend typically has a fundamental reason, whether it’s strong earnings, a new product, or positive industry trends. A rally without a clear fundamental catalyst, especially in a generally bearish market, should be viewed with skepticism. By integrating fundamental analysis with your technical analysis, you develop a more robust framework for discerning genuine opportunities from deceptive false signals, ultimately enhancing your ability to avoid becoming a victim of a bull trap.
Fortifying Your Defenses: Advanced Strategies to Avoid Bull Traps
Preventing yourself from falling into a bull trap requires more than just identifying the signs; it demands discipline, patience, and the implementation of robust trading strategies. Here, we outline advanced techniques to fortify your defenses and navigate these deceptive market reversals.
- Patience and Confirmation: The cardinal rule is to wait for strong confirmation before entering a long position after a perceived breakout. Do not rush in on the first sign of an upward move. What constitutes confirmation? Look for:
- Sustained trading volume after the breakout, not just a momentary spike.
- Multiple bullish candlesticks forming above the broken resistance level, indicating follow-through buying.
- A retest of the broken resistance level, which now ideally acts as support, followed by a bounce. This “break, retest, and rally” pattern offers high-probability confirmation.
- The price staying above the resistance level for at least one full trading day (for daily charts) or several consecutive candles (for lower timeframes).
Jumping in too early is the most common reason traders get caught in a bull trap. Patience is your strongest ally.
- Multi-Timeframe Analysis: Always analyze the asset on multiple timeframes. A rally on a 15-minute chart might look significant, but if the daily or weekly chart is still in a strong downtrend, that rally is far more likely to be a sucker rally. Look for alignment across timeframes. If the higher timeframes confirm the lower timeframe breakout, it adds significant credibility to the move.
- Volume Profile and VWAP (Volume Weighted Average Price): Beyond simple trading volume, consider using volume profile to identify areas of high and low volume concentration. If a breakout occurs but moves into an area of historically low volume, it suggests less support for the price at those levels. Similarly, monitoring the VWAP can give you a sense of the average price that volume was traded at. If the price is struggling to stay above VWAP after a rally, it indicates buying interest is weak.
- Correlation Analysis: Consider how the asset you’re trading correlates with the broader market or its sector. If a tech stock rallies while the overall tech index is plummeting, that rally might be an isolated anomaly, prone to a bull trap. Understanding these correlations helps you gauge the authenticity of a move.
By integrating these advanced strategies, you move beyond basic identification to proactive prevention, building a more robust and adaptive trading framework against market deception.
Mastering Risk Management: Protecting Your Capital from Deception
Even with the most sophisticated identification techniques, the unpredictable nature of financial markets means that no strategy is foolproof. Therefore, the ultimate defense against the financial ramifications of a bull trap lies in impeccable risk management. This is not merely about minimizing losses; it’s about preserving your trading capital to ensure you can participate in future, more genuine, opportunities. For any trader, safeguarding capital is paramount.
- Strict Stop-Loss Orders: This is non-negotiable. Every trade you enter must have a predefined stop-loss order. A stop-loss order automatically closes your position if the price reaches a certain undesirable level, limiting your potential losses. For a long position taken on a perceived breakout, your stop-loss should typically be placed just below the broken resistance level (which should ideally now act as support) or below the low of the breakout candle. If the price falls back below this level, it invalidates your breakout thesis, confirming a bull trap, and your position is closed before losses escalate. Consider also using a trailing stop order, which adjusts your stop-loss upwards as the price moves in your favor, protecting profits while allowing for further gains.
- Position Sizing: Never over-leverage your account or allocate an excessively large portion of your capital to a single trade, especially one based on a potentially deceptive rally. A common rule of thumb is to risk no more than 1-2% of your total trading capital on any single trade. If you are caught in a bull trap, a small position size ensures that the resulting loss is manageable and does not significantly impair your ability to continue trading.
- Diversification: Spreading your investments across different assets, sectors, and geographical regions can help mitigate the impact of a single bull trap in one specific market. While not a direct tool for avoiding a trap, it reduces the overall risk to your portfolio if one of your holdings becomes a victim.
- Psychological Stops: Beyond technical stop-losses, cultivate a psychological stop. This means being prepared to exit a trade if your initial thesis is invalidated, even if your technical stop-loss hasn’t been hit yet. This requires emotional discipline, but it empowers you to act decisively when the market’s true intentions become clear.
- Review and Learn: Every time you identify a potential bull trap, or unfortunately, get caught in one, meticulously review your decision-making process. What signs did you miss? What could you have done differently? Learning from mistakes is the fastest path to developing a more refined and resilient trading strategy.
Effective risk management is the bridge between hopeful speculation and sustainable profitability. It ensures that even when the market lays a trap, your capital remains largely protected.
If you’re considering expanding your trading horizons, perhaps into the nuanced world of forex trading or other CFDs, selecting a robust platform is a critical first step. For those seeking flexibility and technological edge, Moneta Markets stands out. It supports leading platforms like MT4, MT5, and Pro Trader, offering a seamless trading experience with high-speed execution and competitive low spreads. This blend of reliability and performance is essential when navigating volatile market conditions.
Bull Traps in Action: Case Studies Across Different Markets
The deceptive nature of a bull trap is universal, manifesting across various financial instruments, albeit with subtle nuances unique to each market. Examining real-world scenarios helps solidify our understanding.
- Stocks: Imagine a once-dominant tech stock, trading on the Nasdaq, that has seen its value halve over several months due to declining earnings and increased competition. Suddenly, positive analyst commentary or a speculative rumor sparks a swift 15% rally, breaking a minor resistance level. Retail investors, seeing the “bounce,” rush in. However, the trading volume during this rally is noticeably lower than the preceding sell-off, and the rally fails to surpass a key historical trendline resistance. Soon after, institutional selling resumes, pushing the stock to new lows, trapping the eager buyers. This is a classic “dead cat bounce” in action, driven by psychological relief rather than fundamental strength.
- Cryptocurrency: The volatile cryptocurrency market is a hotbed for bull traps due to its rapid price swings and susceptibility to social media hype. Consider a less-established altcoin that has plummeted after a period of irrational exuberance. After weeks of decline, a well-coordinated social media “pump” campaign, perhaps fueled by false promises of a new partnership or listing, triggers a sharp, almost vertical surge of 50-100% in a single day. New traders, fearing FOMO, buy in at the peak. However, this rally occurs on disproportionately low actual buying pressure compared to the initial pump, and the originating wallets quickly begin to offload their holdings, creating a massive sell-off. The price collapses, often below its pre-pump levels, leaving late buyers with worthless tokens – a devastating rug pull and an extreme form of a bull trap. Analyzing the on-chain volume and wallet movements can be crucial here.
- Forex: While forex pairs like GBP/USD might not experience the same “rug pull” scenarios, bull traps are common after significant news events. Suppose the GBP/USD pair has been in a clear downtrend due to negative economic data. A temporary piece of positive news, perhaps a better-than-expected manufacturing report, causes the pair to rally sharply, breaking a short-term resistance level. Many traders go long, anticipating a sustained recovery. However, the positive news is short-lived, or quickly overshadowed by the underlying bearish sentiment and stronger negative macro factors. The price soon reverts to its original downtrend, trapping traders who bought into the false hope. The RSI divergence or a lack of subsequent confirming price action would have been key indicators to watch.
These examples highlight that while the asset class changes, the core mechanics of a bull trap – a deceptive rally followed by a continuation of the original downtrend – remain consistent. Vigilance and a multi-faceted analytical approach are essential across all markets.
Bull Trap vs. Bear Trap: Understanding the Duality of Market Deception
To truly grasp the concept of a bull trap, it’s beneficial to understand its inverse: the bear trap. These two patterns represent the duality of market deception, preying on traders’ biases in opposing market directions. Both are forms of a whipsaw pattern, designed to shake out participants before the true market move continues.
As we’ve thoroughly explored, a bull trap occurs in a prevailing downtrend, luring ‘bulls’ (buyers) into believing a reversal to an uptrend is underway. The price briefly rallies, breaks an immediate resistance level, then abruptly reverses downward, continuing its original descent. The ‘bulls’ who went long positions are caught, suffering losses.
Conversely, a bear trap occurs in a prevailing uptrend. It’s a false signal that tricks ‘bears’ (sellers) into thinking a reversal to a downtrend has begun. The price temporarily dips, breaks a support level, then swiftly reverses upward, continuing its original ascent. The ‘bears’ who opened short positions are then caught, facing losses as the price moves against them. They are “trapped” into shorting an asset that then reverses upward.
Here’s a concise comparison:
| Aspect | Bull Trap | Bear Trap |
|---|---|---|
| Market Context | Occurs in a downtrend. | Occurs in an uptrend. |
| Deception | False belief in an upward reversal. | False belief in a downward reversal. |
| Targeted Traders | Buyers (Bulls) entering long positions. | Sellers (Bears) entering short positions. |
| Key Technical Sign | Price breaks resistance level briefly. | Price breaks support level briefly. |
| Resolution | Price resumes original downtrend. | Price resumes original uptrend. |
Understanding both traps fosters a more balanced, bidirectional trading mentality. It highlights that deception can come from either side of the market. Recognizing these symmetrical patterns enhances your ability to read the market’s true intentions and protect yourself from unexpected reversals, regardless of the prevailing trend.
For individuals venturing into global markets, especially in forex trading, the choice of a brokerage with robust regulatory oversight is paramount. Moneta Markets, for instance, holds multiple international licenses, including from FSCA, ASIC, and FSA. This commitment to regulatory compliance, alongside features like segregated client funds and 24/7 multilingual customer support, offers a layer of security and trust that is indispensable for both novice and seasoned traders.
Cultivating a Resilient Trading Mindset: Learning from Every Trap
Beyond technical charts and risk management formulas, the most formidable defense against a bull trap—and indeed, against any market challenge—is a robust and resilient trading mindset. Markets are designed to test your patience, discipline, and emotional fortitude. Every bull trap, whether you identify it preemptively or unfortunately fall victim to it, presents a profound learning opportunity.
First, embrace humility. The market is rarely predictable, and even the most experienced traders will occasionally misinterpret a signal or find themselves on the wrong side of a move. The key is not to avoid all mistakes, but to minimize their impact and maximize the learning from them. When a perceived rally turns out to be a sucker rally, take the time to analyze why. Was it a lack of volume confirmation? Did you ignore the broader market context? Was FOMO overriding your rational judgment?
Second, develop unwavering discipline. This means sticking to your trading plan, even when emotions are high. If your strategy dictates waiting for two candles of confirmation above a resistance level, do not jump in after one, regardless of how convincing it looks. If your stop-loss order is triggered, accept the small loss and move on, rather than hoping for a reversal that rarely comes. This disciplined approach prevents small errors from escalating into catastrophic losses.
Third, cultivate patience. The market will always offer new opportunities. There is no need to chase every perceived rally. Often, the best trades are those that are patiently waited for, where all your criteria for entry are met, and the signs of a bull trap are conspicuously absent. This patience protects you from impulsive decisions driven by fear of missing out and allows you to preserve capital for higher-probability setups.
Finally, remember that trading is a marathon, not a sprint. Your longevity and profitability in the market depend less on hitting grand slam home runs and more on consistently executing your strategy, managing your risk, and learning from every experience. Each bull trap encountered, whether avoided or suffered, is a lesson etched into your trading psyche, sharpening your instincts and fortifying your resolve. By adopting this resilient mindset, you transform market deception into a catalyst for growth and mastery.
Conclusion: Navigating the Market with Wisdom and Discipline
The journey through financial markets is replete with both immense opportunities and formidable challenges. Among the most deceptive of these challenges is the bull trap, a cunning market phenomenon designed to ensnare unwary traders, leading them into seemingly promising rallies that ultimately collapse, resuming the original downtrend. We have explored the intricate mechanics of this false signal, from its psychological triggers like FOMO and the insidious influence of false news and rug pulls, to its tangible manifestations in trading volume, candlestick patterns, and the crucial insights provided by indicators such as the Relative Strength Index (RSI) divergence.
Our comprehensive exploration has highlighted that while the market is designed to create confusion, you are equipped with powerful tools to navigate its complexities. By patiently waiting for robust confirmation signals, rigorously analyzing trading volume, understanding the broader market context, and critically, by implementing unwavering risk management strategies like strict stop-loss orders, you significantly enhance your ability to detect and evade these traps. Remember, the goal is not to predict every market move flawlessly, but to protect your capital and participate only when the odds are stacked in your favor.
The distinction between a bull trap and a bear trap further underscores the importance of a flexible, bidirectional trading mentality, recognizing that deception can emerge from any market direction. Ultimately, your success in the volatile world of trading hinges on a blend of astute technical analysis, emotional discipline, and a continuous commitment to learning. By approaching the market with wisdom, diligence, and an unwavering commitment to your trading plan, you can transform the perils of the bull trap from a source of frustration into a powerful reminder of the importance of disciplined trading, allowing you to achieve sustainable profitability and confidence in your financial endeavors.
what is a bull trapFAQ
Q:What is a bull trap in trading?
A:A bull trap is a deceptive market movement where a declining asset temporarily shows a rise, luring traders into buying only for the price to fall again, trapping them in unprofitable positions.
Q:How can I identify a bull trap?
A:Look for signs such as low trading volume during a price increase, failure to maintain above key resistance levels, and bearish candlestick patterns that suggest buyers are losing control.
Q:What strategies can help me avoid falling for bull traps?
A:Use strict profit-taking and stop-loss orders, wait for strong confirmation signals before entering trades, and conduct thorough analysis across multiple timeframes.
留言