TradingView stands as a formidable platform within the financial world, serving as a vital canvas for traders and investors seeking to decipher market movements through the lens of technical analysis. Whether you’re a seasoned professional fine-tuning intricate strategies or taking your first steps into the trading arena, your interaction with charts is fundamental. These graphical representations of price action are more than just lines and bars; they are the historical record and the potential future blueprint of a financial instrument’s journey. But like any powerful tool, getting the most out of TradingView requires understanding how to manage your workspace effectively.
- Your TradingView chart acts as your primary cockpit dashboard, crucial for navigation.
- Well-organized charts provide clear, relevant information for trading decisions, preventing confusion.
- Managing your charts effectively enhances your overall analytical capabilities.
In this guide, we will embark on a journey to master the core aspects of managing your TradingView chart views and settings. We’ll explore how to handle your charts across different platforms, particularly the mobile application, learn the essential techniques for clearing away distractions, understand the concept of resetting settings, and delve deep into the myriad customization options available to truly make your charts work for *you*. Our goal is to equip you with the knowledge to maintain a clean, efficient, and insightful charting environment, empowering your technical analysis and contributing to more informed trading outcomes. Ready to take control of your charting experience?
In today’s fast-paced financial markets, being tied to a desktop or laptop is often not feasible. The ability to monitor and analyze charts from anywhere is crucial, and this is where the TradingView mobile app becomes indispensable. However, transitioning from a larger screen to a mobile device can sometimes feel different, especially regarding how charts load and how you switch between them.
| Aspect | Description |
|---|---|
| Continuity | Mobile app loads last chart layout viewed on other devices. |
| Switching Charts | Navigate through saved chart layouts easily using the bottom menu. |
| Accessibility | Quick access to different instrument charts from the app. |
When you first open the TradingView mobile app, particularly on platforms like iOS, you might notice that the chart displayed isn’t necessarily the one you were just looking at moments ago on your phone’s watchlist. Instead, the app is designed for continuity across devices. It typically loads the *last chart layout* you were viewing, whether that was on your web browser version of TradingView or the dedicated Desktop app. This feature aims to provide a seamless experience, picking up right where you left off on your primary analysis platform.
While this continuity is often convenient, there will be many times when you need to quickly switch to a different chart – perhaps to check another stock in your portfolio, analyze a different currency pair, or review a completely different asset class like cryptocurrencies or indices. Navigating to these different charts on the mobile app is straightforward but uses a slightly different interaction model than the desktop interface.
Instead of relying solely on searching for a new ticker, the most efficient way to switch between different *saved chart layouts* or view charts from your watchlists or other lists is through the app’s primary navigation. Typically, you will find a menu or navigation bar at the bottom of the screen. This bottom menu is your gateway to different sections of the app, such as your watchlists, news feeds, and crucially, your saved chart layouts or the ability to search for new symbols.
By tapping on the appropriate icon in the bottom menu – often represented by a chart symbol or a list icon – you can access your saved layouts or lists of instruments. From there, you can select the desired chart layout, and the app will load that specific configuration, including the symbol, time frame, indicators, and drawings saved within that layout. This allows you to quickly jump between your prepared analysis environments even when you’re away from your main workstation. Mastering this simple navigation step is key to effective on-the-go analysis.
As you engage with technical analysis, you will invariably add various elements to your charts. Trend lines, support and resistance zones, Fibonacci retracements, annotation tools, and a multitude of technical indicators like Moving Averages, RSI, MACD, Bollinger Bands – these are the tools of the trade. They help you identify patterns, gauge momentum, and understand market structure. However, just as a workbench can become cluttered with tools after a busy session, your chart can become crowded, making it difficult to see the underlying price action clearly.
- A cluttered chart can lead to confusion and misinterpretation of signals.
- Clear charts allow for a better understanding of price action and more accurate analysis.
- TradingView offers options to efficiently remove clutter from your charts.
The most common elements that contribute to chart clutter are your drawings and your technical indicators. Drawings are the lines, shapes, and text annotations you manually add to the chart. Indicators are the mathematical calculations (often appearing below, above, or overlaid on the price chart) that provide statistical or predictive insights.
To effectively “declutter” your chart, you don’t necessarily need to remove each element individually, although that option is always available by selecting and deleting. TradingView offers a streamlined function to clear multiple elements simultaneously. Based on common TradingView interface designs across platforms (web, desktop, and mobile), there’s usually a menu accessible via a button, often located on the left-hand side panel or toolbar, that provides options related to the chart’s display and tools.
Within this menu, you will typically find options specifically designed for managing chart elements. Look for options like “Remove Drawing Tools” or “Remove Indicators.” Selecting these options will allow you to perform a bulk removal. You might even find a powerful command like “Remove Drawing Tools & Indicators”. Executing this single command will instantly clear all manually added trend lines, shapes, text boxes, and all applied indicators from the currently active chart. This provides an immediate clean view of the price action, allowing you to start your analysis fresh or simply appreciate the naked chart.
| Key Features | Functionality |
|---|---|
| Drawings | Manual lines, shapes, and annotations that can clutter the view. |
| Indicators | Statistical calculations overlaid on the price chart. |
Understanding how to quickly remove these elements is a crucial skill for maintaining an efficient workflow. It serves as a partial reset, specifically targeting the visual overlays that you have added since the chart was loaded or last adjusted. This is different from a full reset of *all* settings, which we will discuss next, but it is incredibly useful for analysts who frequently switch between different analytical approaches or want to periodically cleanse their view for clarity.
Every time you load a chart for a specific stock, cryptocurrency, index, or any other financial instrument on TradingView, it doesn’t just display raw price data. It presents that data according to a predefined configuration. This initial state is based on default settings. Think of default settings as the factory configuration for your chart – the standard way it looks and behaves before you make any personal adjustments.
- Default settings dictate the initial chart type, color scheme, and displayed information.
- Customization allows you to tailor how the chart looks and behaves according to your needs.
- Resetting to default settings gives you a clean slate for new analysis.
These default settings dictate various aspects, such as the initial chart type (often candlestick), the standard color scheme, the information displayed on the price scale, the details shown in the status line at the top, and many other parameters. For example, the default might show volume data at the bottom, use a specific color for bullish and bearish candles, and display OHLC values in the status line.
While default settings provide a functional starting point, TradingView is built for customization. You, as the user, have extensive control to set up and adjust almost every aspect of the chart’s appearance and the data it displays. You can change candle colors, alter the background, modify text sizes, add or remove grid lines, change how the price scale is formatted, select different chart types (like bars, lines, Heikin Ashi, etc.), and much more. These adjustments allow you to tailor the charting environment to your specific preferences, analytical methodology, and even eye comfort.
But what happens if you’ve made so many adjustments over time that the chart no longer serves you well, or you simply want to revert to the original, clean look? This is where the concept of resetting TradingView chart to default settings comes into play. While the term “reset” can sometimes be used loosely to mean just clearing drawings and indicators (as discussed in the previous section), a true reset to default settings implies returning *all* adjustable parameters back to their original, factory state.
- Restore the default chart type.
- Revert colors, fonts, and background settings to their defaults.
- Reset scale formatting and display options.
- Bring back the default status line information.
- Potentially remove drawings and indicators if the default state includes no added elements.
Why would you use a full reset? Perhaps you were experimenting with complex setups and want to start over. Maybe a setting was inadvertently changed, causing a display issue, and resetting is the easiest fix. Or you might simply prefer the default aesthetic and want to quickly return to it after temporary customizations. Understanding that this option exists provides you with the power to quickly restore order and simplicity to your charting environment when needed.
The core of any financial chart is the representation of price data for a specific symbol – be it AAPL for Apple stock, EURUSD for the Euro/US Dollar currency pair, or BTCUSD for Bitcoin. TradingView allows you to go far beyond the default display of this symbol’s price action. Customizing how the symbol itself is rendered on the chart is a powerful way to enhance clarity and make your analysis more efficient.
| Customization Options | Purpose |
|---|---|
| Coloring | Define colors for bullish and bearish candles for better visual differentiation. |
| Line Thickness | Adjust thickness to enhance visibility based on chart context. |
| Precision | Control decimal places for price to match instrument volatility. |
Accessing these settings typically involves right-clicking on the chart itself or accessing the “Chart Settings” menu, often represented by a gear or cogwheel icon. Within the comprehensive settings window, you’ll find a tab or section dedicated to the “Symbol” or “Price Line.” Here, you can control granular details about how the price data is visualized.
Each of these settings, though seemingly minor on their own, contributes to the overall readability and utility of your chart. Taking the time to customize the symbol’s appearance ensures that the fundamental price data is presented in a way that is clear, accurate, and optimized for *your* analytical approach. This is the foundational layer upon which all other technical analysis is built.
If you’re focusing on instruments like currency pairs, precise price data and correct timing (via the Time Zone setting) are paramount. Understanding these details is especially important when selecting a platform for forex trading. If you’re considering starting forex trading or exploring more CFD instruments, Moneta Markets 億匯 is a platform worth considering. It originates from Australia and offers over 1000 financial instruments, suitable for both beginners and professional traders. Tailoring your TradingView charts using the Symbol settings discussed here will provide a clearer picture of price movements, directly benefiting your analysis on a platform like Moneta Markets.
Beyond the price data itself, the axes of the chart – the vertical price scale on the right (or left) and the horizontal time scale at the bottom – are critical for interpreting market movements. TradingView provides extensive control over how these scales are displayed and function, allowing you to optimize your view for different types of analysis and different financial instruments.
- Price Scale Location: Choose between right or left side placements.
- Labels: Control information displayed on the price scale like high/low price labels.
- Scale Type: Choose between logarithmic and arithmetic scales based on analysis needs.
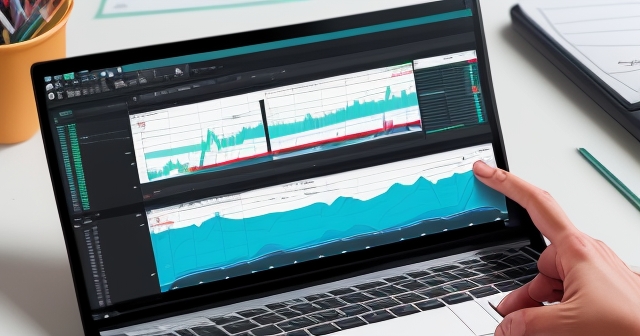
Accessing axis settings is usually done through the same “Chart Settings” menu as symbol appearance, often under a section labeled “Scales.” Here, you’ll find options that dictate how price and time are plotted and labeled.
Effectively configuring your scales provides context and structure to the price data. Displaying relevant labels ensures you can quickly read key price points, while choosing the appropriate scale type (logarithmic vs. arithmetic) ensures that price movements are accurately represented, preventing misinterpretations of trend strength or pattern geometry. Paying close attention to the scale settings transforms the axes from simple boundaries into informative components of your analysis toolkit.
The visual environment in which you conduct your analysis significantly impacts your focus, comfort, and ability to identify patterns. TradingView’s Appearance settings allow you to personalize the chart’s look and feel, from the background color to the smallest text labels. This is where you can make the chart truly yours, optimizing it for visibility during long trading sessions and aligning it with your aesthetic preferences.
- Background: Choose solid or gradient backgrounds to reduce eye strain.
- Grid Lines: Control their visibility and adjust colors and thickness for clarity.
- Text: Choose readable font types and sizes for clarity.
The Appearance settings offer a level of personalization that can significantly impact your trading psychology and efficiency. A visually comfortable and clear chart reduces fatigue and allows you to focus on the analysis itself. Experimenting with different themes and settings will help you discover what works best for your individual needs and the conditions under which you trade.
Price data can be represented in various ways on a chart, and TradingView offers a comprehensive selection of chart types, each providing a slightly different perspective on market movement. The choice of chart type is not merely aesthetic; it fundamentally changes how you perceive price action and can highlight different aspects of market behavior relevant to your analysis or strategy.
- Bars: Vertical line chart showing price range for specific periods.
- Candles: Visual representation of price actions through body and wicks.
- Line: Simple connection of closing prices for trend identification.
Experimenting with different chart types can reveal patterns or insights that might not be obvious on your standard view. While many traders primarily use candlesticks, understanding and occasionally using other types like Line or Heikin Ashi can complement your analysis, providing alternative perspectives on the market’s structure and momentum. Your choice of chart type should align with your specific analytical goals and the characteristics of the market you are trading.
The choice of time interval is directly linked to your trading style and objectives: Short time frames for day traders, medium for swing traders, and long for investors. Many successful traders utilize a “multiple time frame analysis” approach, looking at the same instrument on several different time frames to gain comprehensive insight.
Switching time intervals in TradingView is typically done via a dropdown menu or dedicated buttons located prominently on the chart interface, often next to the symbol selection. You can also configure frequently used intervals for quick access.
Choosing the appropriate time interval (or set of intervals) is paramount for aligning your analysis with your trading goals. Looking at a 5-minute chart for a long-term investment decision would be like using a magnifying glass to study a landscape painting – you’d miss the bigger picture entirely. Conversely, trying to scalp on a Daily chart would be impossible.
The cursor is your pointer on the chart, your connection to specific price points and times. TradingView allows you to customize the cursor’s appearance and behavior, enhancing your ability to pinpoint exact data points and conduct precise measurements.
- Crosshair Mode: Toggle between standard pointer and crosshair for better alignment.
- Crosshair Synchronization: Synchronize across multiple charts for more detailed analysis.
- Data Window Visibility: Access exact values where your cursor is located for accurate readings.
A well-configured crosshair, especially when synchronized across multiple time frames, allows for precise alignment of price and time across your entire workspace. This seemingly small detail is fundamental for accurate measurement of price movements, identification of exact swing highs/lows, and correlating events across different charts – all cornerstones of detailed technical analysis.
We’ve discussed various aspects of chart settings, from the mobile app view to clearing clutter, understanding resets, and diving into the details of symbol appearance, scales, appearance, chart type, and time intervals. At this point, you might ask: why bother with all this customization? Why not just stick to the defaults?
- Improve Clarity and Readability: Customizing reduces visual strain and makes key patterns easier to spot.
- Tailor the Chart to Your Strategy: Customize to highlight information most relevant to your specific trading approach.
- Optimize Workflow Efficiency: Familiar layouts and quick-clearing functions enhance analysis efficiency.
Your TradingView chart is your laboratory, your canvas. Taking control of its settings and appearance empowers you to conduct your analysis with greater precision, clarity, and efficiency.
TradingView provides a robust and highly customizable platform for financial charting and technical analysis. From navigating your saved layouts on the convenient mobile app to wielding the power of clearing unwanted drawings and indicators for a clean view, and understanding the option to perform a full reset to default settings, you now have a solid understanding of the foundational aspects of chart management.
Beyond these reset and clearing functions, we delved into the critical customization options that allow you to truly personalize your charting experience: fine-tuning the symbol’s appearance, mastering the intricacies of the price and time scales, optimizing the chart’s overall look and feel, selecting the most appropriate chart type for your analysis, and choosing the right time intervals to match your trading rhythm.
Each setting and feature discussed serves a purpose – to enhance clarity, improve efficiency, and provide deeper insights into market dynamics. By taking the time to understand and utilize these controls, you transform your TradingView charts from generic price displays into powerful, personalized tools tailored specifically to your analytical needs and trading strategies.
Effective chart management isn’t just about aesthetics; it’s a fundamental skill that directly impacts the quality of your technical analysis and, consequently, your trading decisions. A well-organized chart reduces confusion, highlights critical information, and allows you to focus on reading the market’s story. Whether you are tracking stocks, cryptocurrencies, indices, or foreign exchange pairs, having mastery over your charting environment is non-negotiable for serious traders.
Continue to explore TradingView’s extensive features, experiment with different settings, and build chart layouts that support your unique approach to the markets. The knowledge and control you gain over your charting platform will undoubtedly contribute to more confident, disciplined, and potentially profitable trading endeavors.
how to reset chart on tradingview mobile app常見問題(FAQ)
Q:How can I reset my charts to default settings on TradingView?
A:You can reset your charts by accessing the chart settings menu and selecting the option to reset to default settings, which will return all configurations to their original parameters.
Q:What happens when I remove drawings and indicators?
A:Removing drawings and indicators clears the chart of any manual annotations and technical overlays, providing a clean slate for new analysis.
Q:Can I customize my chart settings on the TradingView mobile app?
A:Yes, the TradingView mobile app allows you to customize various settings including chart type, appearance, and time intervals to suit your trading needs.
留言