Mastering MACD: Your Guide to the Moving Average Convergence/Divergence Indicator
Welcome to our in-depth exploration of the Moving Average Convergence/Divergence, more commonly known as the MACD. As traders seeking to understand the pulse of the markets, you will encounter this powerful technical indicator frequently. Developed by Gerald Appel in the 1970s, the MACD has stood the test of time, becoming a cornerstone tool for identifying price trends, measuring momentum, and locating potential buy and sell entry points. Think of the MACD not just as lines on a chart, but as a dynamic speedometer and compass for market sentiment, helping you navigate the ebb and flow of price action.
Our goal today is to demystify the MACD, breaking down its components, understanding its signals, and learning how to effectively integrate it into your trading strategies. Whether you are just starting your journey in technical analysis or looking to refine your existing approach, grasping the nuances of MACD is a valuable step towards mastering the art of trading. We will cover its fundamental structure, the logic behind its calculations, and the various ways traders interpret its movements to make informed decisions. Are you ready to unlock the potential of this classic indicator?
To enhance your understanding of the MACD, here are a few key points to keep in mind:
- The MACD serves as a tool for trend identification and momentum analysis.
- It is based on the difference between two exponential moving averages (EMAs).
- The MACD is widely used by traders for spotting potential entry and exit points.
What is MACD and Its Core Purpose?
At its heart, the MACD is a trend-following momentum indicator. What does that mean? It means it helps us see both the direction of a trend and the speed at which that trend is moving. Unlike indicators that might show fixed overbought or oversold levels, the MACD provides a relative measure of momentum, showing how rapidly a security’s price is changing and whether that change is strengthening or weakening the current trend.
Imagine you’re driving a car. The MACD is like looking at both the speedometer and a trend line on your GPS simultaneously. The speedometer tells you your current speed (momentum), and the GPS line shows you the road’s general direction (trend). The MACD combines these ideas by comparing two different exponential moving averages (EMAs) of a security’s price. An EMA gives more weight to recent prices, making it more responsive to new information than a simple moving average (SMA).
The core purpose of the MACD is to highlight changes in the strength, direction, momentum, and duration of a trend. By analyzing the relationship between these two EMAs, and their relationship to a third moving average derived from their difference, the MACD generates signals that traders use to anticipate potential shifts in market behavior.
Why use EMAs? Because they are designed to smooth out price data while still reacting relatively quickly to new price changes. This balance between smoothing and responsiveness is crucial for a momentum indicator that aims to identify shifts early enough to be actionable.
Here’s a concise breakdown of the MACD’s function:
| Feature | Description |
|---|---|
| Indicator Type | Trend-following momentum indicator |
| Components | Two EMAs, MACD line, Signal line |
| Main Purpose | Identify price trends and momentum shifts |
The MACD Calculation: Building the Foundation
Understanding how the MACD is calculated is key to interpreting its signals correctly. It is built upon three specific exponential moving averages (EMAs), which you will typically see referred to by their default periods: 12, 26, and 9.
The primary component is the MACD line. This line is calculated by taking the 12-period EMA of the security’s closing price and subtracting the 26-period EMA of the closing price. The formula is simple:
MACD Line = (12-period EMA) - (26-period EMA)
Why 12 and 26 periods? These are the traditional settings chosen by Gerald Appel. The 12-period EMA is the faster-moving average, and the 26-period EMA is the slower-moving average. By subtracting the slower from the faster, the MACD line essentially measures the difference between the two. When the faster EMA is above the slower EMA, the MACD line is positive, suggesting upward momentum. When the faster EMA is below the slower EMA, the MACD line is negative, suggesting downward momentum.
The MACD line oscillates above and below a central point, known as the Zero Line or baseline. The Zero Line represents the point where the 12-period EMA and the 26-period EMA are equal. When the MACD line is above the zero line, it indicates that the 12-period EMA is above the 26-period EMA, generally confirming bullish momentum. When the MACD line is below the zero line, it indicates that the 12-period EMA is below the 26-period EMA, suggesting bearish momentum. The further the MACD line moves from the zero line, the stronger the momentum in that direction.
This calculation forms the backbone of the MACD indicator. It provides a continuous line that captures the interplay between short-term and longer-term price momentum, relative to the historical path defined by the EMAs.
The calculations of the MACD can be summarized in the following table:
| Component | Calculation Formula | Interpretation |
|---|---|---|
| MACD Line | 12-period EMA – 26-period EMA | Shows momentum direction |
| Signal Line | 9-period EMA of the MACD Line | Smoothens MACD movements for signals |
| Histogram | MACD Line – Signal Line | Visuals of momentum strength |
The Signal Line: Your Trading Trigger
The MACD line itself provides valuable information about momentum, but it can be quite volatile, leading to potential false signals. To help smooth out the MACD line and provide clearer trading triggers, a second line is introduced: the Signal Line.
The Signal Line is a 9-period EMA of the MACD line itself. Its calculation is:
Signal Line = 9-period EMA of the MACD Line
Think of the Signal Line as a moving average *of the momentum*. Because it averages the MACD line’s movement over the past 9 periods, the Signal Line moves slower and is less jagged than the MACD line. This smoothing effect is crucial because the interaction between the faster MACD line and the slower Signal Line generates the most common and actionable trading signals.
The crossovers between the MACD line and the Signal Line are central to MACD interpretation. When the MACD line crosses above the Signal Line, it is often interpreted as a bullish signal, suggesting that the short-term momentum (represented by the MACD line) is picking up relative to its recent average (represented by the Signal Line). Conversely, when the MACD line crosses below the Signal Line, it is typically seen as a bearish signal, indicating that short-term momentum is weakening relative to its recent average.
These crossovers provide potential entry and exit points for traders. A bullish crossover might suggest a time to buy or add to a position, while a bearish crossover might suggest a time to sell or exit a position. The strength and reliability of these signals often depend on where they occur relative to the Zero Line and the overall price trend, which we will discuss further.
Here are some important aspects of the Signal Line:
- It smoothens the MACD line to reduce volatility.
- Crossovers with the MACD line indicate potential buy or sell signals.
- Analyzing the distance between the MACD line and Signal Line provides insight into momentum strength.
The MACD Histogram: Visualizing the Momentum Gap
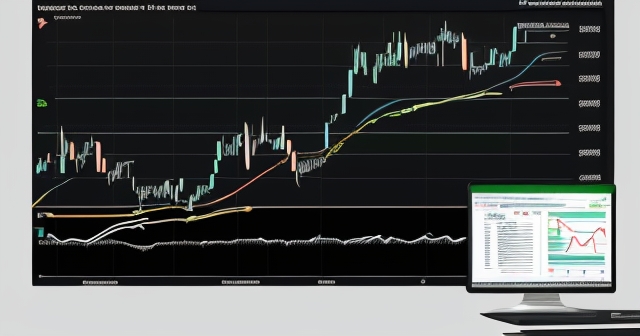
Complementing the MACD line and the Signal Line is the MACD Histogram. This visual component provides a clear representation of the distance between the MACD line and the Signal Line, offering insights into the strength of the current momentum.
The Histogram is calculated simply by subtracting the Signal Line from the MACD line:
MACD Histogram = MACD Line - Signal Line
The Histogram is displayed as a bar chart, typically oscillating above and below the Zero Line. When the MACD line is above the Signal Line (a bullish condition), the Histogram bars are positive (above the zero line). When the MACD line is below the Signal Line (a bearish condition), the Histogram bars are negative (below the zero line).
The height of the Histogram bars is particularly informative. Expanding bars indicate increasing momentum in the direction of the crossover. For example, if the MACD line crosses above the Signal Line, and the positive Histogram bars start getting taller, it suggests that bullish momentum is strengthening. Conversely, contracting bars indicate decreasing momentum. If the positive bars start getting shorter after a bullish crossover, it might suggest that the upward momentum is waning, even if the MACD line is still above the Signal Line. This contraction is often a sign that the lines are moving towards a potential bearish crossover.
Some traders view changes in the Histogram’s direction as potentially leading signals. For instance, if the price is still rising, but the Histogram bars start getting shorter (making lower highs or higher lows), it might signal that the bullish momentum is fading *before* the MACD line actually crosses below the Signal Line. This can provide an earlier warning sign of a potential trend change or consolidation.
Understanding the Histogram adds another layer of depth to your MACD analysis, helping you visualize the force behind the MACD/Signal line relationship.
Here’s a quick view of the MACD Histogram’s components:
| Feature | Description |
|---|---|
| Representation | Distance between MACD line and Signal line |
| Visual Format | Bar chart oscillating above/below Zero Line |
| Momentum Insight | Indicates current trend strength |
Default Settings and Adaptability: 12, 26, 9, and Beyond
The traditional and most commonly used settings for MACD are the 12, 26, and 9 periods. These settings were the original parameters chosen by Gerald Appel and are often used in conjunction with daily charts. The 12-period EMA is meant to capture the faster, short-term momentum, typically reflecting about two and a half weeks of trading (based on 5 trading days per week). The 26-period EMA represents a longer-term momentum, roughly equivalent to one month of trading.
The 9-period EMA for the Signal Line is intended to provide a smoothed average of the MACD line over approximately one and a half weeks of trading. This combination of fast, slow, and signal period aims to balance responsiveness to new price movements with the smoothing necessary to filter out excessive noise and generate reliable crossover signals.
However, it is important to recognize that these are just default settings, not rigid rules. The MACD is highly adaptable and can be used with different timeframes and period lengths. Traders often experiment with alternative settings depending on the security they are trading, the timeframe they are analyzing (e.g., hourly, 4-hour, weekly charts), and their specific trading style.
For example, a day trader might use shorter periods, such as 5, 13, and 1 for the MACD line and Signal Line, respectively, to capture rapid price movements within a single trading day. Conversely, a long-term investor analyzing weekly charts might use longer periods, such as 26, 52, and 9, to focus on broader, more sustained trends.
The key is to choose settings that are appropriate for the volatility of the instrument and the timeframe you are analyzing. While the 12, 26, 9 settings are a good starting point, especially for beginners working with daily charts, don’t hesitate to explore how modifying these parameters might impact the indicator’s sensitivity and the types of signals it generates for your specific trading context. Always test any new settings thoroughly on historical data before applying them to live trading.
If you are considering starting forex trading or exploring more CFD products, then Moneta Markets is a platform worth considering. Based in Australia, it offers over 1000 financial instruments, making it suitable for both novice and professional traders. Exploring different assets might require adjusting your MACD settings to better suit their unique characteristics.
Interpreting MACD Signals: The Power of Crossovers
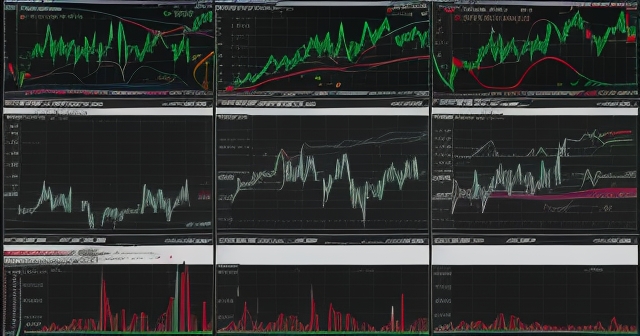
The most fundamental and widely used signals generated by the MACD come from the interaction between the MACD line and the Signal Line. These are known as crossovers. Understanding these crossovers is crucial for identifying potential trading opportunities.
Bullish Crossover: A bullish crossover occurs when the MACD line crosses above the Signal Line. This suggests that the short-term momentum (captured by the faster MACD line) is beginning to accelerate upwards faster than its recent average (captured by the slower Signal Line). It is often interpreted as a potential buy signal or a sign that a bullish trend is strengthening. The lower the crossover occurs below the Zero Line, the more significant it might be seen as a potential reversal from a bearish trend. A bullish crossover above the Zero Line typically indicates the continuation or strengthening of an existing bullish trend.
Bearish Crossover: A bearish crossover occurs when the MACD line crosses below the Signal Line. This indicates that the short-term momentum is starting to decelerate or accelerate downwards faster than its recent average. It is often interpreted as a potential sell signal or a sign that a bearish trend is strengthening. The higher the crossover occurs above the Zero Line, the more significant it might be seen as a potential reversal from a bullish trend. A bearish crossover below the Zero Line typically suggests the continuation or strengthening of an existing bearish trend.
These crossovers can be powerful, but like any indicator signal, they are not foolproof. They can sometimes generate false signals, especially in choppy or sideways markets where the lines might weave back and forth frequently. Traders often look for confirmation from other technical indicators or price action before acting on a MACD crossover signal. For instance, does the crossover align with a break of a key support or resistance level? Is the trading volume increasing in the direction of the signal?
Paying attention to the steepness of the crossover can also be helpful. A sharp, decisive crossover often suggests stronger momentum than a shallow, gradual one. Similarly, the time spent above or below the Signal Line after a crossover indicates the persistence of the momentum in that direction.
Here’s a summary of crossover strategies:
| Crossover Type | Signal | Action |
|---|---|---|
| Bullish Crossover | MACD line crosses above Signal line | Consider a buy |
| Bearish Crossover | MACD line crosses below Signal line | Consider a sell |
| Zero Line Cross | MACD crosses above/below Zero Line | Confirm trend direction |
Zero Line Crosses: Shifting Between Bullish and Bearish Territory
Beyond the MACD line and Signal Line crossovers, the MACD also provides signals based on its relationship to the Zero Line. Remember, the Zero Line is the point where the 12-period EMA equals the 26-period EMA. Crossing this line signifies a shift in the dominance between the faster and slower moving averages.
Bullish Zero Cross: A bullish zero cross occurs when the MACD line crosses above the Zero Line. This signifies that the 12-period EMA has crossed above the 26-period EMA. It is often seen as a confirmation that bullish momentum is taking hold or that a bullish trend is establishing itself. Traders might interpret this as a stronger buy signal than a bullish Signal Line crossover that occurs below the Zero Line, as it suggests the shorter-term average is now leading the longer-term average. This signal tends to be more of a trend confirmation signal than an early entry signal.
Bearish Zero Cross: A bearish zero cross occurs when the MACD line crosses below the Zero Line. This means the 12-period EMA has crossed below the 26-period EMA. It is often interpreted as a confirmation that bearish momentum is dominating or that a bearish trend is underway. Similar to the bullish zero cross, this is more of a trend confirmation signal. Traders might see this as a stronger sell signal than a bearish Signal Line crossover that occurs above the Zero Line.
Zero line crosses typically occur *after* a Signal Line crossover and are often used as confirmation of a trend change indicated by the earlier crossover. For example, a trader might look for a bullish Signal Line crossover below the Zero Line, followed by a bullish Zero Line crossover, as a two-step confirmation of a potential upward reversal and the establishment of a new bullish trend.
The distance of the MACD line from the Zero Line also provides information about the strength of the trend. The further the MACD line is above the Zero Line, the stronger the bullish momentum. The further it is below the Zero Line, the stronger the bearish momentum. Extreme distances from the Zero Line, especially when combined with rapid rises or falls, can sometimes indicate potential overextended moves, although MACD doesn’t have fixed overbought/oversold levels like RSI.
Identifying Divergence: A Signal of Potential Change
One of the most powerful, yet sometimes tricky, signals the MACD can generate is divergence. Divergence occurs when the price of a security is moving in one direction, but the MACD indicator is moving in the opposite direction. This discrepancy can signal that the current trend is weakening and a potential reversal might be on the horizon.
There are two main types of divergence:
Bullish Divergence: Bullish divergence occurs when the price makes a lower low, but the MACD makes a higher low. This means that while the price is continuing its downward trajectory, the selling momentum (as measured by the MACD) is actually decreasing. The ‘force’ behind the downtrend is fading. This can be a signal that the bearish trend is losing steam and a bullish reversal might be approaching. Traders often look for a subsequent bullish Signal Line crossover or Zero Line crossover to confirm the potential reversal indicated by the bullish divergence.
Bearish Divergence: Bearish divergence occurs when the price makes a higher high, but the MACD makes a lower high. In this scenario, the price is still rising, but the buying momentum (as measured by the MACD) is weakening. The ‘force’ behind the uptrend is decreasing. This can signal that the bullish trend is weakening and a bearish reversal might be approaching. Traders often look for a subsequent bearish Signal Line crossover or Zero Line crossover to confirm the potential reversal indicated by the bearish divergence.
Divergence can be a valuable early warning sign, potentially indicating a change in momentum *before* the price action clearly reverses. However, it is crucial to note that divergence is not always followed by a reversal. Price can continue to move in the trend direction even when divergence is present, especially in very strong trends or during periods of consolidation. This brings us to one of the key limitations of MACD divergence: the potential for ‘false positive’ signals, particularly in sideways or slow-trending markets.
Identifying divergence requires careful observation of both price action and the MACD indicator. Look for clear highs and lows on both the price chart and the MACD line. The higher low (for bullish divergence) or lower high (for bearish divergence) on the MACD should correspond to the lower low or higher high on the price chart, respectively. Confirmation from other indicators or price action is highly recommended before making trading decisions based solely on divergence.
Rapid Moves: Momentum Extremes and Potential Overextension
While MACD does not have fixed overbought or oversold levels like oscillators such as the Relative Strength Index (RSI), the speed and extent of the MACD line’s movement can still provide clues about potential overextension in a price move. When the MACD line experiences a rapid rise or a rapid fall, it suggests exceptionally strong momentum in that direction.
A rapid rise occurs when the MACD line shoots up sharply, moving far above the Zero Line and the Signal Line. This indicates that the 12-period EMA is accelerating significantly faster than the 26-period EMA, reflecting strong buying pressure and bullish momentum. While this confirms a powerful uptrend, an extremely rapid move can sometimes suggest that the price has moved too far, too fast, and might be due for a temporary pullback or consolidation, even if the overall trend remains intact.
Similarly, a rapid fall occurs when the MACD line plunges sharply, moving far below the Zero Line and the Signal Line. This signifies that the 12-period EMA is decelerating or falling significantly faster than the 26-period EMA, indicating strong selling pressure and bearish momentum. This confirms a powerful downtrend, but an extremely rapid decline might suggest the price is potentially oversold on a short-term basis and could experience a bounce or retracement.
Interpreting rapid moves requires context. Are they occurring at key support or resistance levels? Is there accompanying volume data? While MACD doesn’t give you a specific ‘overbought at 70’ reading, its historical extremes can provide a relative sense of when momentum might be reaching a peak. For example, if the MACD line has rarely extended more than +10 on a particular stock’s daily chart, a reading of +15 or +20 might suggest the bullish move is becoming stretched.
Trading solely based on rapid moves can be risky, as strong trends can persist for longer than you might anticipate. However, recognizing extreme MACD readings can be useful when combined with other analysis, potentially suggesting caution when momentum appears to be reaching unsustainable levels. It highlights the intensity of the current directional movement.
MACD vs. Other Oscillators: A Comparison with RSI
Traders often wonder how MACD compares to other popular momentum oscillators. A common comparison is with the Relative Strength Index (RSI). While both indicators measure momentum, they do so in different ways and provide different types of signals.
The RSI measures the speed and change of price movements by comparing the magnitude of recent gains to recent losses. It oscillates between 0 and 100 and is primarily used to identify overbought (typically above 70) and oversold (typically below 30) conditions. RSI is often seen as a **leading indicator** in the sense that it can reach overbought/oversold extremes before the price trend changes.
The MACD, as we’ve discussed, measures the relationship between two EMAs. It oscillates around a Zero Line and does not have fixed boundaries like 0 and 100. Its primary signals come from crossovers (MACD/Signal, MACD/Zero) and divergence. While some traders use rapid MACD moves to suggest overextension, there are no universal ‘overbought’ or ‘oversold’ levels. MACD is generally considered a **lagging indicator** because it is based on historical moving averages, although its Histogram changes can sometimes provide earlier signals.
Here’s a simple analogy: If price is like a car, RSI is like an accelerometer measuring how quickly the car is speeding up or slowing down (the rate of change in gains vs losses). MACD is like measuring the difference between the car’s average speed over the last 12 minutes versus the last 26 minutes. Both measure momentum, but they are looking at different aspects of the car’s movement.
So, which one should you use? Many traders use both! They complement each other well. RSI might signal potential overbought conditions, suggesting caution, while MACD might simultaneously show bullish momentum is still strong (MACD above Zero) or confirm an entry signal with a bullish crossover. Using both can provide a more comprehensive view of market momentum and potential turning points.
When choosing a trading platform, the flexibility and technical advantages of Moneta Markets are noteworthy. It supports popular platforms like MT4, MT5, and Pro Trader, combining high-speed execution with low spread settings to provide an excellent trading experience. These platforms allow you to apply and analyze indicators like MACD and RSI seamlessly across various markets.
Limitations of MACD: Understanding the Drawbacks
While the MACD is a powerful and versatile indicator, it is not without its limitations. Recognizing these drawbacks is crucial for using MACD effectively and avoiding costly mistakes.
1. Lagging Nature: As an indicator based on moving averages (which are calculated from historical price data), MACD is inherently a lagging indicator. Signals are generated based on past price movements, meaning they might occur somewhat after the actual price turn has begun. This is particularly true for the Zero Line crossovers, which confirm a trend change but often happen well after the initial shift in momentum.
2. False Signals in Sideways/Choppy Markets: MACD performs best in trending markets, whether bullish or bearish. In sideways markets or periods of low volatility and price consolidation, the MACD line and Signal Line can weave back and forth across each other and the Zero Line repeatedly. This generates numerous crossover signals that do not lead to significant price moves, resulting in whipsaws and false trades.
3. False Divergence Signals: Divergence, while potentially powerful, is a signal prone to ‘false positives’. Price can exhibit divergence with MACD and yet continue to extend in the direction of the original trend, especially in strong, persistent trends. Traders acting solely on divergence without confirmation risk entering against a powerful trend too early.
4. No Fixed Overbought/Oversold Levels: Unlike indicators like RSI or Stochastic, MACD does not provide standard overbought/oversold thresholds. What constitutes an ‘extreme’ MACD reading is relative to the specific security and its historical MACD range. This requires more subjective interpretation and experience to judge when momentum might be becoming overextended.
5. Dependence on Settings: While adaptability is a strength, it’s also a limitation. The performance and types of signals generated by MACD can vary significantly depending on the chosen periods (12, 26, 9 vs. other values). Using inappropriate settings for the instrument or timeframe can lead to poor results.
Because of these limitations, it is rarely recommended to use MACD in isolation. It is most effective when used in conjunction with other technical analysis tools and techniques, such as price action analysis, chart patterns, support and resistance levels, and other indicators that can provide confirmation or a different perspective on market conditions.
Confirmation is Key: Using MACD with ADX and Other Tools
Given MACD’s limitations, particularly its tendency for false signals in non-trending markets and the risk of false divergence, confirmation is absolutely key to improving its reliability. How can you confirm a MACD signal? By using other indicators that provide complementary information.
One highly recommended indicator for confirming MACD signals, especially trend direction and strength, is the Average Directional Index (ADX), which is part of the Directional Movement Index (DMI) system. ADX measures the strength of a trend, but not its direction. It typically ranges from 0 to 100. A rising ADX (often above 20 or 25) suggests that a trend is present and strengthening, regardless of whether it’s an uptrend or a downtrend. A falling ADX suggests that the trend is weakening or that the market is entering a consolidation phase.
Here’s how you might use ADX to confirm MACD:
- If you get a bullish MACD crossover or Zero Line cross, check the ADX. Is the ADX line rising and above 20 or 25? If so, it confirms that a trend is developing or strengthening in the direction of the MACD signal, lending more credibility to the signal.
- If you get a bearish MACD crossover or Zero Line cross, check the ADX. Is the ADX line rising and above 20 or 25? This confirms that a downtrend is likely developing or strengthening, reinforcing the bearish MACD signal.
- If MACD generates a signal (either a crossover or divergence) but the ADX is low (below 20 or 25) and/or falling, it suggests the market is ranging or trendless. In this scenario, the MACD signal is less reliable and should be treated with caution, or potentially ignored. This is particularly useful for filtering out false divergence signals that occur in non-trending markets.
Beyond ADX, you can use other tools for confirmation:
- Support and Resistance Levels: Does a bullish crossover occur as price bounces off a significant support level? Does a bearish crossover happen as price tests a major resistance level? Signals that coincide with key price levels tend to be more robust.
- Chart Patterns: Does a MACD signal align with the breakout from a bullish pattern (like a triangle or flag) or the breakdown from a bearish pattern (like a head and shoulders or double top)?
- Volume: Does a bullish signal come with increasing buying volume? Does a bearish signal come with increasing selling volume? Volume can confirm the conviction behind a price move.
- Other Indicators: Consider combining MACD with volume indicators, volatility indicators (like Bollinger Bands), or other trend-following indicators to build a more complete picture.
The key takeaway here is that MACD provides insights into momentum and trend direction, but its signals gain significant reliability when confirmed by other technical evidence. Using it in conjunction with tools that assess trend strength (like ADX) or key price levels can dramatically improve your trading outcomes.
Applying MACD in Trading Strategies: Entry and Exit Points
Now that we understand the components and signals of MACD, how do we actually apply it in real-world trading? MACD is highly versatile and can be used to identify potential entry and exit points in various trading strategies.
Using Crossovers for Entries:
- Bullish Entry: A common strategy is to enter a long position when the MACD line crosses above the Signal Line. For more conservative entry, wait for this crossover to occur below the Zero Line, signaling a potential shift from bearish to bullish momentum. Even more conservatively, some traders wait for a bullish Zero Line cross as confirmation that a bullish trend is establishing itself.
- Bearish Entry: Conversely, a common strategy is to enter a short position when the MACD line crosses below the Signal Line. For more conservative entry, wait for this crossover to occur above the Zero Line, signaling a potential shift from bullish to bearish momentum. A bearish Zero Line cross can serve as a more conservative entry or confirmation of a bearish trend.
Using Crossovers for Exits:
- Exiting a Long Position: When holding a long position, a bearish MACD crossover (MACD line crossing below the Signal Line) can serve as a signal to exit the trade, suggesting that upward momentum is fading and a potential price decline is imminent.
- Exiting a Short Position: When holding a short position, a bullish MACD crossover (MACD line crossing above the Signal Line) can serve as a signal to exit the trade, suggesting that downward momentum is weakening and a potential price rise is approaching.
Using Divergence: Divergence signals are often used for anticipating potential reversals and preparing for entry/exit. A bullish divergence might prompt a trader to look for a subsequent bullish crossover as an entry signal or to tighten stops on a short position. A bearish divergence might lead a trader to look for a bearish crossover as an entry for a short trade or consider exiting a long position.
Day Trading with MACD: MACD is also a popular tool for day traders. By using shorter timeframes (e.g., 5-minute, 15-minute charts) and potentially adjusting the MACD periods to be more sensitive to intraday price swings, day traders can use MACD crossovers and divergence to spot short-term momentum shifts and potential breakouts or reversals for quick entry and exit points.
Remember, successful application involves more than just blindly following signals. Consider the overall market context, the trend on higher timeframes, and always combine MACD with other forms of analysis and risk management techniques, such as setting stop-loss orders and profit targets.
If you are looking for a regulated and globally accessible forex broker, Moneta Markets holds multiple regulatory licenses such as FSCA, ASIC, and FSA. It also offers segregated fund accounts, free VPS, and 24/7 Chinese customer support, making it a preferred choice for many traders looking to apply these technical strategies in live market conditions.
The Sage’s Synthesis: Combining MACD for Smarter Decisions
As we conclude our deep dive into the MACD, let’s synthesize the knowledge we’ve gained. The MACD is a versatile indicator that provides a unique view of market momentum by analyzing the relationship between two Exponential Moving Averages. Its components – the MACD line, Signal Line, and Histogram – each offer distinct insights.
We’ve learned that MACD signals are primarily derived from:
- Crossovers: The MACD line crossing the Signal Line provides direct buy/sell triggers based on shifts in momentum relative to its short-term average.
- Zero Line Crosses: The MACD line crossing the Zero Line confirms a shift in the overall bullish or bearish momentum bias, indicating when the faster EMA crosses the slower EMA.
- Divergence: Discrepancies between price action and the MACD line can serve as early warning signs of potential trend reversals, though requiring careful confirmation.
- Rapid Moves: Extreme readings suggest powerful momentum but can also hint at potential, albeit relative, overextension.
We also candidly discussed the MACD’s limitations, including its lagging nature and the potential for false signals, particularly divergence in non-trending markets. This understanding underscores the crucial principle of confirmation – using MACD alongside other tools like ADX, support/resistance, or chart patterns to build conviction and filter out less reliable signals.
Think of the MACD as one essential tool in your technical analysis toolbox. It excels at showing you the momentum behind the price movement and identifying potential points where that momentum is changing direction or strength. However, it tells you less about volatility, fixed price levels, or the strength of the underlying trend *itself* (which is where ADX becomes helpful). By combining MACD with other indicators and forms of analysis, you move closer to developing a robust and comprehensive trading strategy.
Mastering MACD requires practice and experience. Observe how it behaves on different securities and timeframes. Experiment with settings (while understanding the default). Most importantly, integrate it thoughtfully into your overall trading plan, ensuring that its signals are confirmed and aligned with your risk management rules. Used wisely, the MACD can significantly enhance your ability to understand market dynamics and make more informed trading decisions.
what is the macdFAQ
Q:What does MACD stand for?
A:MACD stands for Moving Average Convergence/Divergence.
Q:How does MACD signal a trend change?
A:MACD signals a trend change through crossovers between the MACD line and the Signal line.
Q:Can MACD be used in any market?
A:Yes, MACD can be used in various financial markets, including stocks, forex, and commodities.
留言